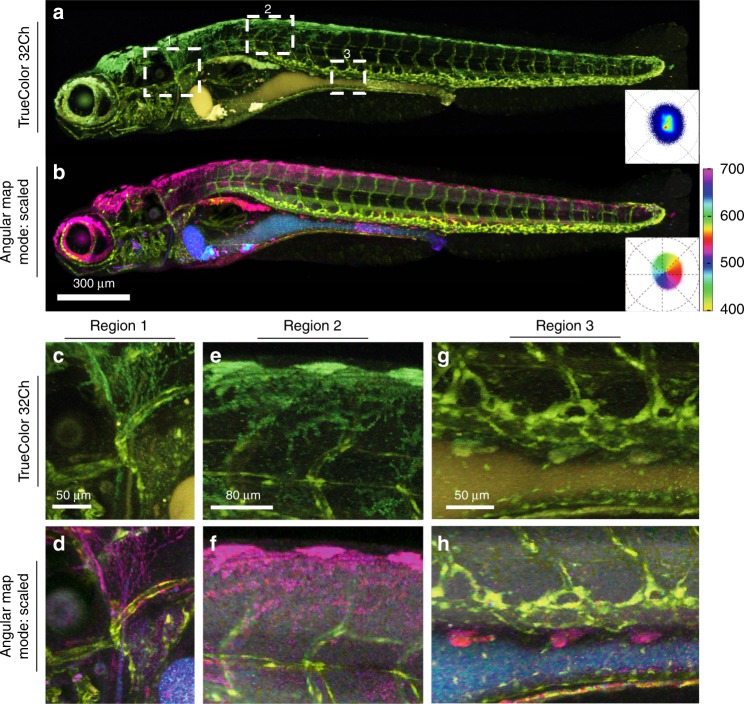
IMAGE

Fig. 5

ID
ZDB-IMAGE-200514-6
Source
Figures for Shi et al., 2020
Image
Figure Caption

Fig. 5 Visualization of a single fluorescence label against multiple autofluorescences.

Tg(fli1:mKO2) (pan-endothelial fluorescent protein label) zebrafish was imaged with intrinsic signal arising from the yolk and xanthophores (pigment cells). Live imaging was performed using a multispectral confocal (32 channels) fluorescence microscope with 488 nm excitation. The endothelial mKO2 signal is difficult to distinguish from intrinsic signals in a (a) maximum intensity projection TrueColor 32 channels Image display (Bitplane Imaris, Switzerland). The SEER angular map highlights changes in spectral phase, rendering them with different colors (reference map, bottom right of each panel). b Here we apply the angular map with scaled mode on the full volume. Previously indistinguishable spectral differences (boxes 1, 2, 3 in panel a) are now easy to visually separate. Colorbar represents the main wavelength associated to one color in nanometers. ch Zoomed-in views of regions 1–3 (from a) visualized in TrueColor (c, e, g) and with SEER (d, f, h) highlight the differentiation of the pan-endothelial label (yellow) distinctly from pigment cells (magenta). The improved sensitivity of SEER further distinguishes different sources of autofluorescence arising from yolk (blue and cyan) and pigments.

Acknowledgments
This image is the copyrighted work of the attributed author or publisher, and ZFIN has permission only to display this image to its users. Additional permissions should be obtained from the applicable author or publisher of the image. Full text @ Nat. Commun.