
- Title
-
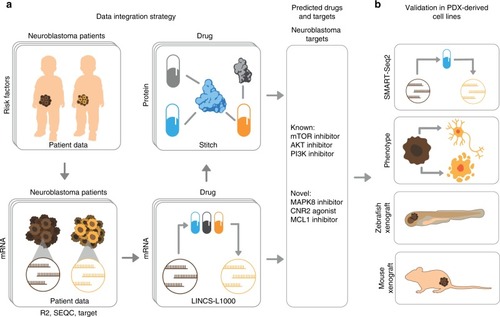
Integrative discovery of treatments for high-risk neuroblastoma
- Authors
- Almstedt, E., Elgendy, R., Hekmati, N., Rosén, E., Wärn, C., Olsen, T.K., Dyberg, C., Doroszko, M., Larsson, I., Sundström, A., Arsenian Henriksson, M., Påhlman, S., Bexell, D., Vanlandewijck, M., Kogner, P., Jörnsten, R., Krona, C., Nelander, S.
- Source
- Full text @ Nat. Commun.
|
|
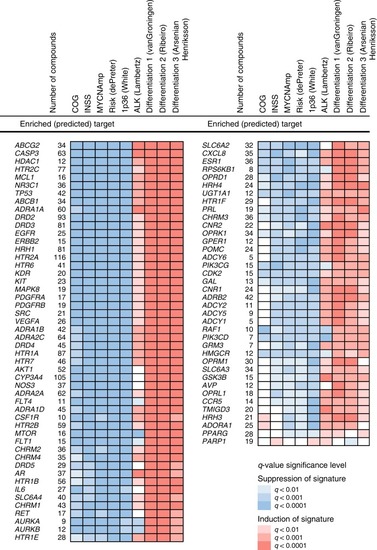
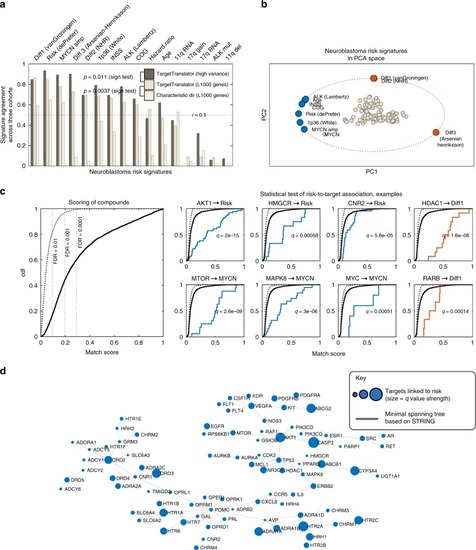
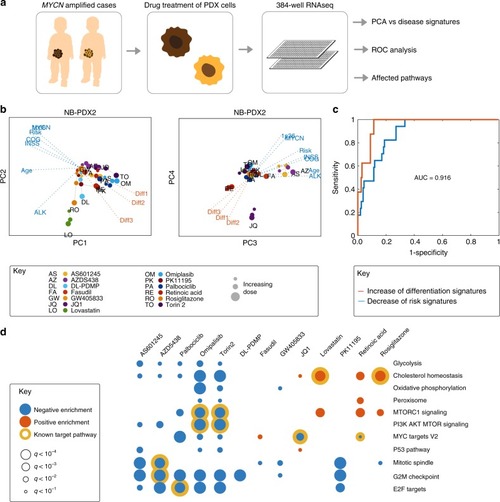
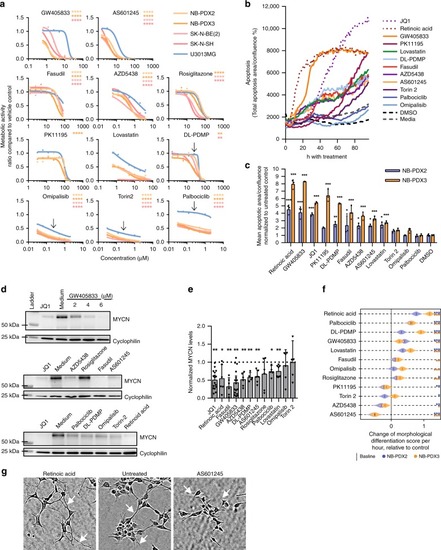
88 drug targets predicted by TargetTranslator. Red: target is associated with induction of signature; Blue: target is associated with suppression of signature. Shades represent strength of |
|
|
|