|
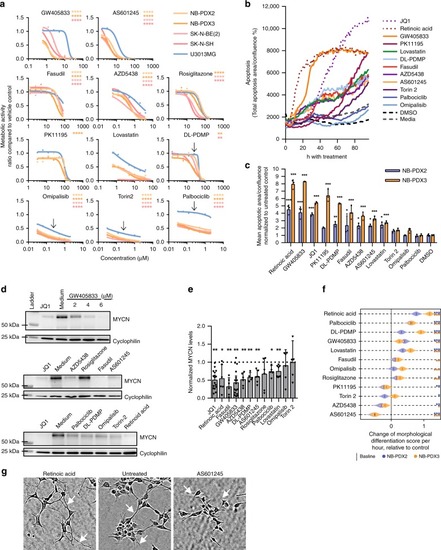
Predicted targets suppressed malignant phenotypes in patient-derived neuroblastoma cells.a Viability response of four neuroblastoma (red) and one glioblastoma (blue, U3013MG) cell lines after 72 h of treatment. Asterisks indicate the level of significance for each neuroblastoma cell line compared with U3013MG. (When applicable, IC50 was used for statistical comparisons, otherwise, the dose is indicated by the arrow.) b, c Apoptotic response (cleaved CASP3/7) of each compound (mean, n = 3) and comparison of compounds at 96 h time point (mean, standard deviation). d Reduction of N-Myc levels after 48 h drug exposure at IC50 concentrations, cropped image. The full image is found in the Source Data file. e Quantified N-Myc levels for both NB-PDX2 and NB-PDX3 (mean, 95% confidence interval; JQ1, GW, n = 16; lovastatin, n = 8; omipalisib, RA, AZD5438, rosiglitazone, fasudil, AS601245, n = 6; palbociclib, DL-PDMP, Torin-2, n = 5; one-sample t-test with Benjamini–Hochberg FDR correction). f IC10 drug effects of neurite outgrowth for NB-PDX2 (blue) and NB-PDX3 (yellow), bootstrapping estimates (n = 1000). A higher morphological differentiation score indicates longer cell protrusions. Stars show significance levels compared with negative control for the respective cell lines. g Representative image of cell protrusions (white arrow) after 72 h of treatment. *p < 0.05, **p < 0.01, ***p < 0.001, ****p < 0.0001.
|