|
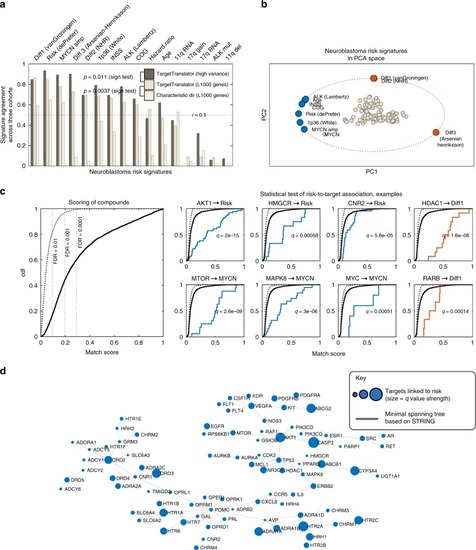
Detection of multiple targets linked to neuroblastoma risk factors.a Validation of neuroblastoma risk signatures by each signature's agreement across three independent cohorts (R2, TARGET and SEQC). Dark grey = signatures constructed by TargetTranslator, using high variance genes; grey = TargetTranslator, L1000 landmark genes; white = L1000 landmark genes, using the Characteristic direction algorithm. b Principal component analysis of the 10 most reproducible signatures, showing risk factors at unit length and marker genes as points; note collinearity between signatures and the distinct/opposing direction of differentiation signatures. Blue: signatures associated with disease pathways or poor outcome. Red: signatures associated with differentiation. c Left: Matching compounds and drugs in L1000 to neuroblastoma signatures; score empirical cumulative distribution function (ecdf) for 19763 drugs, based on L1000 from 14 cell lines (dashed line = permutation control). Right: Detection of enriched targets by shifts in the ecdf curve. L1000 compounds were mapped to drug targets using the STITCH database. Examples of drugs with a common target are highlighted (coloured curve). Note examples of confirmed (AKT1, MTOR, HDAC1), predicted (HMGCR, MAPK8, CNR2) and control targets (MYC, RARB, associated to MYCN and differentiation signatures, respectively). q are FDR-controlled p-values of a Kolmogorov–Smirnoff test that compares target-specific compounds (coloured curve) vs other compounds. d Visualization of pathway dependencies for all targets with q-value < 0.0001, mapped to the minimal spanning tree (MST) of all STRING links between targets. (MST facilitates visualization, by removing redundant links).
|