|
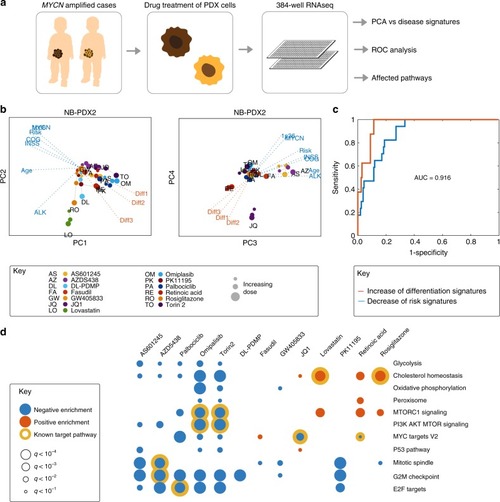
RNA profiling confirmed modulation of neuroblastoma risk signatures.a Experiment concept. b Principal component analysis of results for patient 1 (NB-PDX2). Note similar directions of PI3K and MTOR inhibitors omipalisib (OM) and torin-2 (TO) along PC1, and differentiation-inducing agents retinoic acid and JQ1 along PC 4. See also Supplementary Fig. 3. c ROC curve analysing the predictive power of TargetTranslator, defined as the ability to predict (from the public data sources) whether a particular gene signature will decrease (blue) or increase (red) after drug treatment; showing average for 10 risk signatures and all tested drugs, overall area under the curve correctness of 0.916. d Gene Set Enrichment Analysis (GSEA) of drug-induced changes, showing suppressed (blue) and induced (red) pathways. Yellow circles mark the known action of each corresponding drug.
|