IMAGE

Fig. 1

ID
ZDB-IMAGE-200406-132
Source
Figures for Almstedt et al., 2020
Image
Figure Caption

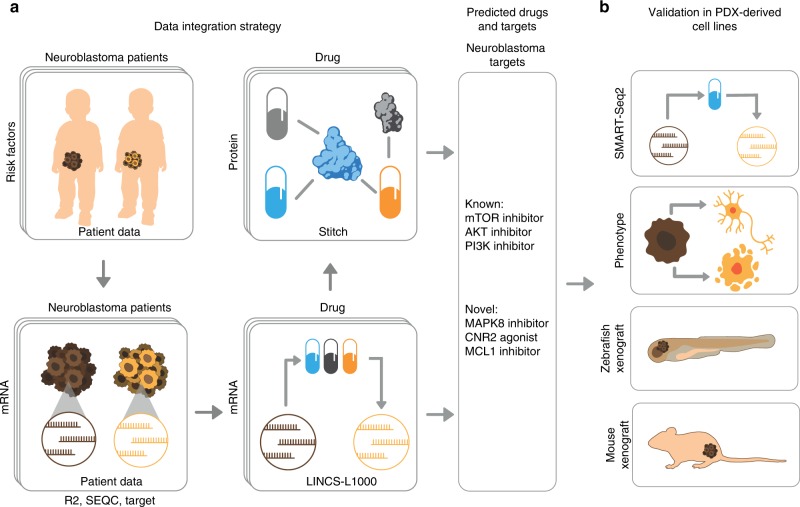
Fig. 1 Integrative discovery of treatments for high-risk neuroblastoma.

a Step 1: Data integration. We combined omics data from three cohorts of high-risk neuroblastoma (R2, TARGET and SEQC) to construct risk signatures, which were linked to pharmaco-transcriptomic (L1000) and drug target (STITCH) data, resulting in associations between disease signatures and therapeutic targets. b Step 2: Experimental evaluation. Using tumour cells from high-risk cases, we combine RNA sequencing, cell-based assays, and animal models to confirm targets.

Acknowledgments
This image is the copyrighted work of the attributed author or publisher, and ZFIN has permission only to display this image to its users. Additional permissions should be obtained from the applicable author or publisher of the image. Full text @ Nat. Commun.