- Title
-
Unique and non-redundant function of csf1r paralogues in regulation and evolution of post-embryonic development of the zebrafish
- Authors
- Caetano-Lopes, J., Henke, K., Urso, K., Duryea, J., Charles, J.F., Warman, M.L., Harris, M.P.
- Source
- Full text @ Development
|
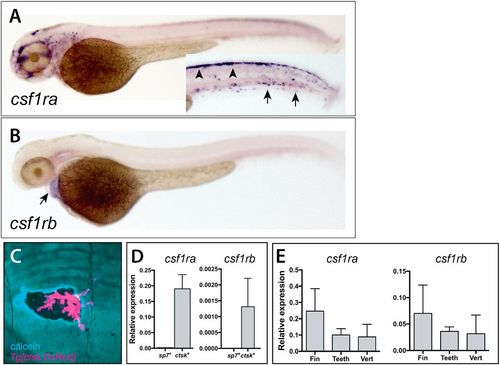
Divergent expression of csf1ra and csf1rb during zebrafish early development and in scales of the adult zebrafish. Whole-mount in situ hybridization of csf1ra (A) and csf1rb (B). (A) csf1ra is expressed in cells of the pigment and hematopoietic lineages at 2 dpf; inset shows the trunk in different focal plane with pigment cells precursors (arrowheads) and hematopoietic cells (arrows). (B) In contrast, csf1rb is expressed at only low levels in the heart (arrow) at 2 dpf. (C) Expression of Tg[cstk:DsRed] in osteoclasts localizes at areas of remodeling, as shown by increased calcein staining (blue) at the periphery of the remodeled pit. (D,E) Analysis of expression of csf1r paralogues in isolated cells and from adult skeletal tissues. (D) Expression of csfr1a and csf1rb in isolated adult osteoblasts (sp7+ cells) and osteoclasts (ctsk+ cells) from wild-type zebrafish. (E) Detection of both paralogues in isolated tissues [fin, teeth and vertebra (vert)]. |
|
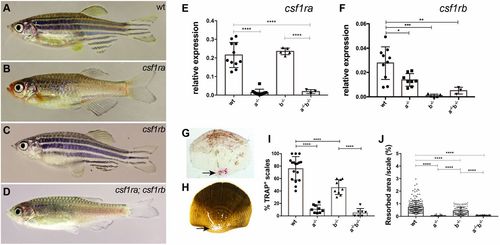
Adult phenotypes of csf1ra and csf1rb mutants. (A-D) Representative photomicrographs of adult (A) wild-type zebrafish (wt), (B) homozygous csf1ramh5, (C) csf1rbmh108 and (D) csf1ramh5;csf1rbmh112 mutant zebrafish. (E,F) Quantitative RT-PCR of csf1ra and csf1rb in isolated scales of wild type, or mutants singly homozygous for csf1ra (a−/−) or csf1rb (b−/−), and of double mutants (a−/−b−/−). (G,H) Representative photomicrographs of scales collected from 10 wpf wild-type fish stained using TRAP (G, arrow) and (H) modified Von Kossa staining (arrow). (I,J) Quantitation of TRAP and Von Kossa staining in wild-type and mutant scales. For TRAP activity, each data point represents the percentage of scales stained by TRAP obtained by evaluating 10 scales per fish. For Von Kossa analysis, each data point represents the percentage of resorbed area per individual scale. Data are mean±s.d. *P<0.05, **P<0.01, ***P<0.001, ****P<0.0001. EXPRESSION / LABELING:
PHENOTYPE:
|
|
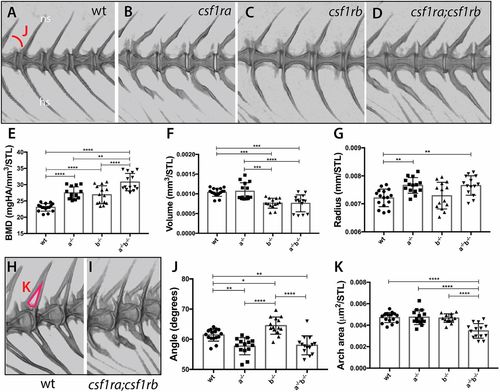
Loss of csf1r paralogue function leads to unique and shared phenotypes in the skeleton. MicroCT imaging and quantification of skeletal metrics of the spine of age-matched csf1r mutants and wild-type adult siblings. (A-D) MicroCT renderings of the lateral aspect of the spine showing overall morphology and integration of serial vertebrae. The neural spines (ns) and hemal spines (hs) are indicated. The measure used for the quantification of angle of the arch (J) is noted in A. (E-G,J,K) Quantification of vertebral shape and density in csf1r single and double mutants: (E) bone mineral density (BMD), (F) bone volume, (G) vertebral radius, (J) angle and (K) area of the neural arch. All measurements, with the exception of angle, were standardized to standard length (STL). (H,I) visualization of neural arch area in wild-type (H) and csf1ra; csf1rb mutant (I) zebrafish; measured area used for quantification of the arch area (K) is indicated in red in H. Data are mean±s.d. *P<0.05, **P<0.01, ***P<0.001, ****P<0.0001. PHENOTYPE:
|
|
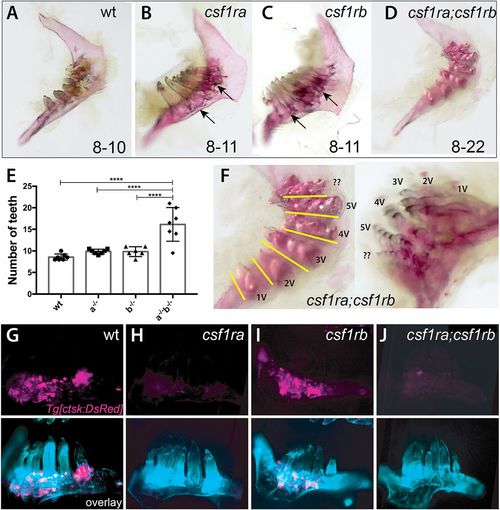
csf1r genes show combinatorial effects in regulating patterning of the dentition and tooth number. (A-D,F) Alizarin Red stained pharyngeal arches from 4 month post-fertilization (mpf) csf1r mutants and wild-type siblings. Numbers on the bottom represent the range of tooth numbers on each arch (n=7). Arrows indicate buildup of bone surrounding base of teeth in csf1ra and csf1rb mutants (B,C). (E) Quantification of the number of teeth represented in csf1r mutants, double mutants and wild-type siblings (****P<0.0001). (F) Higher magnification images of dentitions from csf1ra;csf1rb double mutants showing organization of supernumerary teeth into distinct tracts (yellow line) associated with a row of normal tooth germ patterning in wild-type dentitions (Fig. S6). (G-J) Localization of ctsk-positive cells (magenta) on the dentary of zebrafish csf1r mutants. Bottom, overlay with calcein stain (cyan). |
|
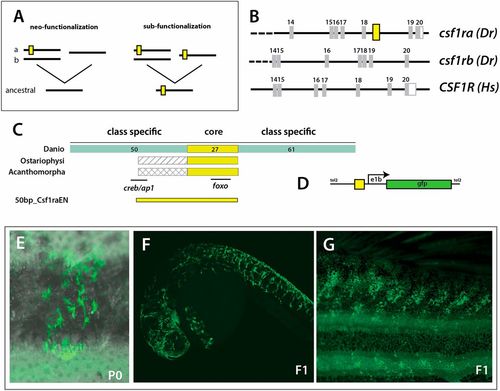
Evolution of a unique enhancer controlling csf1ra expression in pigmentation and its variation. (A) Schematic of different mechanistic hypotheses of evolution of csf1r regulation. Duplication of an ancestral csf1r gene has led to two lineages in vertebrates within teleost fishes having two copies, ‘a’ and ‘b’, and tetrapods having one copy. The functional difference between ‘a’ and ‘b’ could be a consequence of neo-functionalization, where ‘a’ gained functionality in pigment cells; or sub-functionalization, where ‘a’ and ‘b’ retained partial functionality of the ancestral gene; yellow box represents a hypothetical enhancer regulating expression in pigment precursors. (B) Identification of a conserved non-coding element (CNE) among fishes within csf1ra, not found in csf1rb or tetrapod csf1r sequences; Dr, Danio rerio; Hs, Homo sapiens; yellow box represents the position of the CNE. (C) Schematic and alignment of putative enhancer. Within Danios a broad 150 bp sequence is conserved with a ∼27 bp core sequence showing a 100% identity with all other teleost fishes (ostariophysans and acanthomorphs). The numbers of bp in each region are indicated. (D) Schematic of expression construct containing a 50 bp conserved region (50bp_Csf1raEN). (E-G) Representative clone of pigment cells observed in injected adult animals and in 1 dpf and adult individuals in the F1 generation; overlay of brightfield and fluorescence (E). |

