
|
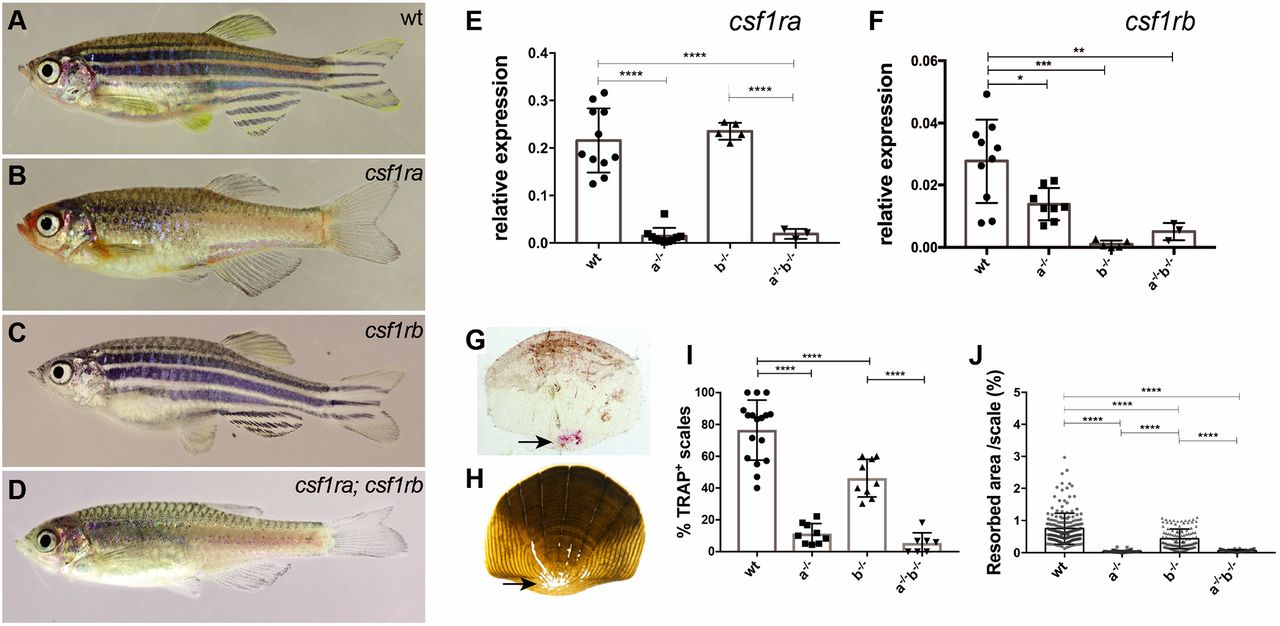
Fig. 2 Adult phenotypes of csf1ra and csf1rb mutants.
(A-D) Representative photomicrographs of adult (A) wild-type zebrafish (wt), (B) homozygous csf1ramh5, (C) csf1rbmh108 and (D) csf1ramh5;csf1rbmh112 mutant zebrafish. (E,F) Quantitative RT-PCR of csf1ra and csf1rb in isolated scales of wild type, or mutants singly homozygous for csf1ra (a−/−) or csf1rb (b−/−), and of double mutants (a−/−b−/−). (G,H) Representative photomicrographs of scales collected from 10 wpf wild-type fish stained using TRAP (G, arrow) and (H) modified Von Kossa staining (arrow). (I,J) Quantitation of TRAP and Von Kossa staining in wild-type and mutant scales. For TRAP activity, each data point represents the percentage of scales stained by TRAP obtained by evaluating 10 scales per fish. For Von Kossa analysis, each data point represents the percentage of resorbed area per individual scale. Data are mean±s.d. *P<0.05, **P<0.01, ***P<0.001, ****P<0.0001.