
- Title
-
Dorsal convergence of gastrula cells requires a Vangl2 and adhesion protein-dependent change in protrusive activity
- Authors
- Prince, D.J., Jessen, J.R.
- Source
- Full text @ Development
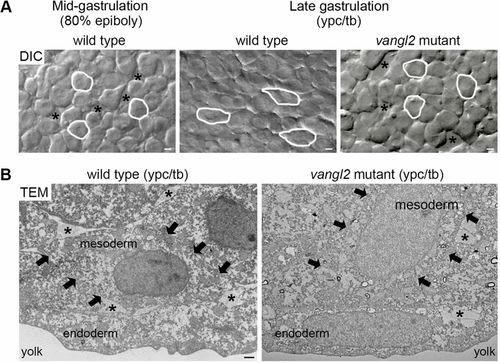
Vangl2-dependent changes in mesodermal cell behavior at late gastrulation. (A) Single-frame DIC time-lapse images highlighting morphological differences between wild-type mesendodermal cells at mid-gastrulation and mesodermal cells at late gastrulation (Jessen et al., 2002; Roszko et al., 2015). The mesoderm of a late gastrulation stage vangl2vu67/vu67 mutant embryo is shown for comparison. Images are oriented as shown in Fig. 2A with dorsal to the right and anterior to the top. Selected cells are outlined to show elongation and alignment relative to the dorsal-ventral body axis. Asterisks mark intercellular gaps. Scale bars: 5 µm. (B) Normal and defective PCP, as viewed in cross-sectioned images (6500× magnification) of late gastrulation wild-type and vangl2m209/m209 mutant deep mesodermal cells taken using transmission electron microscopy (TEM). Black arrows indicate the boundaries of single mesodermal cells. Asterisks indicate the presence of ECM between cells. Scale bar: 1 µm. |
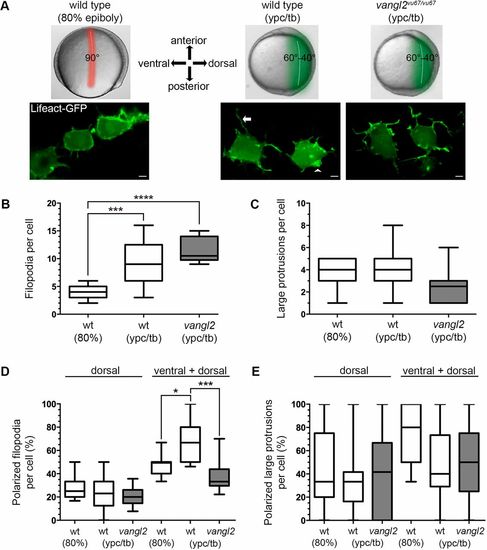
Vangl2 is required for polarized filopodia at late gastrulation. (A) Live embryo images of gastrulation stages and embryonic regions analyzed in this study (top). Confocal live cell images of lateral mesendodermal and mesodermal cells at 80% epiboly and the ypc/tb stage, respectively (bottom). Filopodia (arrow) and larger actin-rich protrusions (arrowhead) are labeled with Lifeact-GFP. The images are oriented in relation to the anterior-posterior and dorsal-ventral embryonic body axes. Scale bars: 5 µm. (B,C) Quantitation of filopodia and large protrusion numbers in wild-type and vangl2vu67/vu67 mutant embryos (wild type at 80% epiboly, n=7 cells, 6 embryos; wild type at ypc/tb, n=13 cells, 10 embryos; vangl2 mutant, n=10 cells, 6 embryos). (D,E) Percentage of polarized filopodia and large protrusions formed in relation to the dorsal-ventral body axis. Box plots show the interquartile dataset, the median and the data range. *P<0.05, ***P<0.001, ****P<0.0001; unpaired Student's t-test with Welch's correction. |
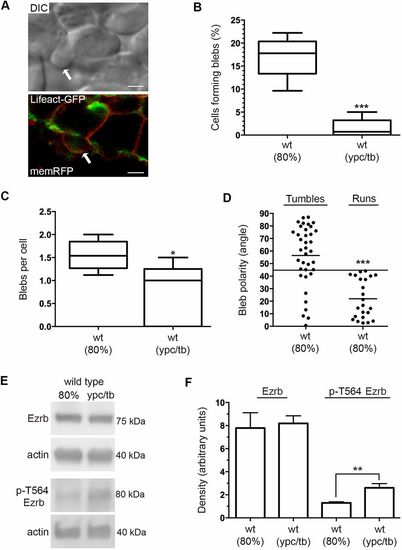
Bleb protrusions at mid- and late gastrulation. (A) DIC and confocal live cell images of different lateral mesendodermal cells at 80% epiboly. Cells are labeled with Lifeact-GFP (green) and memRFP (red). Arrows indicate bleb protrusions. Scale bars: 5 µm. (B) Percentage of wild-type cells forming bleb protrusions during 15 min time-lapse imaging (wild type at 80% epiboly, n=675 cells, 5 embryos; wild type at ypc/tb, n=700 cells, 5 embryos). (C) Quantitation of blebs per cell. (D) Bleb protrusion angles (in degrees) in relation to cell movement direction during tumble and run phases (wild type, n=25 cells, 2 embryos). Long black line denotes a protrusion angle of 45°. (E) Representative western blots of total and phospho-Ezrb (T564) expression in wild-type embryos. (F) Quantitation of western blot band density normalized to β-actin (n=3 experimental replicates). Box plots (B,C) show the interquartile dataset, the median and the data range. Scatter plot (D) shows individual data points and average values. Bar graph (F) shows average values±s.d. *P<0.05, **P<0.01, ***P<0.001; unpaired Student's t-test with Welch's correction, except D (Watson non-parametric two-sample U2 test). |

Greater bleb protrusion formation disrupts PCP and directed migration. (A) Live embryo and DIC control images (reproduced from Fig. 2A and Fig. 1A, respectively) of lateral mesodermal cells at the ypc/tb stage. Control and wild-type embryo injected with ezrb MO. White boxes indicate approximate position of microscopic analysis. DIC images are oriented as shown in Fig. 2A with dorsal to the right and anterior to the top. Select cells are outlined to show elongation and alignment relative to the dorsal-ventral body axis. D, dorsal. Scale bars: 5 µm. (B) Percentage of cells forming bleb protrusions during the 15 min time-lapse imaging (wild type at 80% epiboly+ca-ezrb, n=560 cells, 4 embryos; wild type at ypc/tb+ezrb MO, n=400 cells, 4 embryos; wild type at ypc/tb+ezrb MO+ca-ezrb mRNA, n=140 cells, 5 embryos). (C) PCP quantitation of lateral mesendodermal and mesodermal cells (wild type at 80% epiboly, n=150 cells, 4 embryos; wild type at 80% epiboly+ca-ezrb, n=126 cells, 4 embryos; wild type at ypc/tb, n=265 cells, 8 embryos; wild type at ypc/tb+ezrb MO, n=137 cells, 4 embryos; wild type at ypc/tb+ezrb MO+ca-ezrb mRNA, n=93 cells, 4 embryos). (D) MLA data from C depicted as individual data points (in degrees). Long black line indicate 20°. (E) Cell migration tracks toward the dorsal body axis. Origins (black arrows) were standardized for comparison. (F) Directness values for individual cells (wild type at 80% epiboly, n=50 cells, 3 embryos; wild type+ca-ezrb at 80% epiboly, n=60 cells, 3 embryos; wild type at ypc/tb, n=44 cells, 3 embryos; wild type+ezrb MO at ypc/tb, n=77 cells, 3 embryos). Box plot (B) shows the interquartile dataset, the median and the data range. Scatter plots (D,F) show individual data points and average values. *P<0.05, **P<0.01, ***P<0.001, ****P<0.0001; unpaired Student's t-test with Welch's correction, except D (Watson non-parametric two-sample U2 test). |
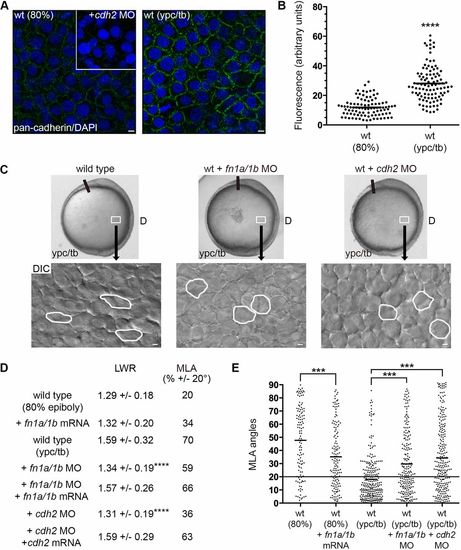
Fibronectin and Cdh2 regulate mesodermal PCP. (A,B) Greater plasma membrane expression of Cdh2 in wild-type embryos at the ypc/tb stage compared with 80% epiboly. Inset shows antibody labeling in the cdh2 morphant. (C) Live embryo and DIC control images (reproduced from Fig. 2A and Fig. 1A, respectively) of lateral mesodermal cells at the ypc/tb stage. Control and wild-type embryos injected with fn1a/1b MO and cdh2 MO. White boxes indicate approximate position of microscopic analysis. DIC images are oriented as shown in Fig. 2A, with dorsal to the right and anterior to the top. Selected cells are outlined to show elongation and alignment relative to the dorsal-ventral body axis. D, dorsal. (D) PCP quantitation of lateral mesendodermal and mesodermal cells (wild type at 80% epiboly+fn1a/1b mRNA, n=140 cells, 5 embryos; wild type at ypc/tb+fn1a/1b MO, n=211 cells, 5 embryos; wild type at ypc/tb+fn1a/1b MO+fn1a/1b mRNA, n=73 cells, 4 embryos; wild type at ypc/tb+cdh2 MO, n=238 cells, 4 embryos; wild type at ypc/tb+cdh2 MO+cdh2 mRNA, n=60 cells, 3 embryos). (E) MLA data from D depicted as individual data points (in degrees). Long black line indicates 20°. Scatter plots (B,E) show individual data points and average values. ***P<0.001, ****P<0.0001; unpaired Student's t-test with Welch's correction except E (Watson non-parametric two-sample U2 test). Scale bars: 5 µm. |
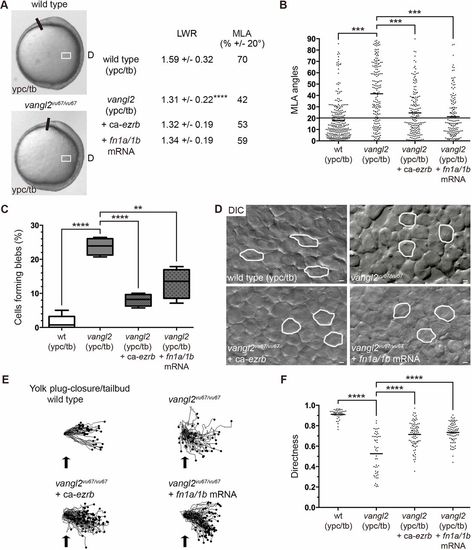
Loss of vangl2 causes greater blebbing at late gastrulation. (A) Live control and vangl2vu67/vu67 mutant embryo images (reproduced from Fig. 2A) at the ypc/tb stage. White boxes indicate approximate position of microscopic analysis. D, dorsal. PCP quantitation of lateral mesodermal cells (vangl2vu67/vu67, n=180 cells, 4 embryos; vangl2vu67/vu67+ca-ezrb, n=175 cells, 4 embryos; vangl2vu67/vu67+fn1a/1b mRNA, n=150 cells, 3 embryos). (B) MLA data from A depicted as individual data points (in degrees). Long black line indicates 20°. (C) Percentage of cells forming bleb protrusions during the 15 min time-lapse imaging (vangl2vu67/vu67, n=560 cells, 4 embryos; vangl2vu67/vu67+ca-ezrb, n=560 cells, 4 embryos; vangl2vu67/vu67+fn1a/1b mRNA, n=560 cells, 4 embryos). (D) Live embryo DIC images of lateral mesodermal cells oriented as shown in A and Fig. 2A with dorsal to the right and anterior to the top. Wild-type and vangl2 mutant images are reproduced from Fig. 1A. Selected cells are outlined to show elongation and alignment relative to the dorsal-ventral body axis. Scale bars: 5 µm. (E) Cell migration tracks toward the dorsal body axis. Origins (black arrows) were standardized for comparison. (F) Directness values for individual cells (vangl2vu67/vu67, n=50 cells, 3 embryos; vangl2vu67/vu67+ca-ezrb, n=80 cells, 3 embryos; vangl2vu67/vu67+fn1a/1b mRNA, n=75 cells, 3 embryos). Box plot (C) shows the interquartile dataset, the median and the data range. Scatter plots (B,F) show individual data points and average values. **P<0.01, ***P<0.001, ****P<0.0001; unpaired Student's t-test with Welch's correction except B (Watson non-parametric two-sample U2 test). |
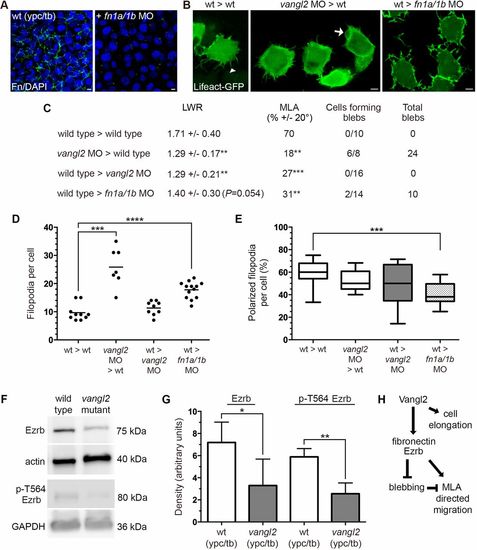
vangl2 acts cell-autonomously to regulate bleb protrusive activity. (A) Wild-type control and fn1a/1b MO-injected host embryo immunolabeled using a fibronectin (Fn) antibody and stained with DAPI. (B) Lifeact-GFP labeled donor cells transplanted to host embryos (dorsal to the right). White arrowhead marks a single filopodia and white arrow indicates a bleb protrusion. (C) PCP and bleb protrusion quantitation for lateral mesodermal donor cells (wild type>wild type, n=10 cells, 5 embryos; vangl2 MO>wild type, n=8 cells, 3 embryos; wild type>vangl2 MO, n=16 cells, 6 embryos; wild type>fn1a/1b MO, n=14 cells, 4 embryos). (D,E) Donor cell filopodia protrusion number (D) and polarization in relation to the dorsal-ventral body axis (E). (F) Representative western blots of total and phospho-Ezrb (T564) expression in wild-type control and vangl2vu67/vu67 mutant embryos. (G) Quantitation of western blot band density normalized to β-actin or GAPDH (n=3 experimental replicates). (H) Summary diagram of key experimental findings. Scatter plot (D) shows individual data points and average values. Box plot (E) shows the interquartile dataset, the median and the data range. Bar graph (G) shows average values±the s.d. *P<0.05, **P<0.01, ***P<0.001, ****P<0.0001; unpaired Student's t-test with Welch's correction. Scale bars: 5 µm. |