
|
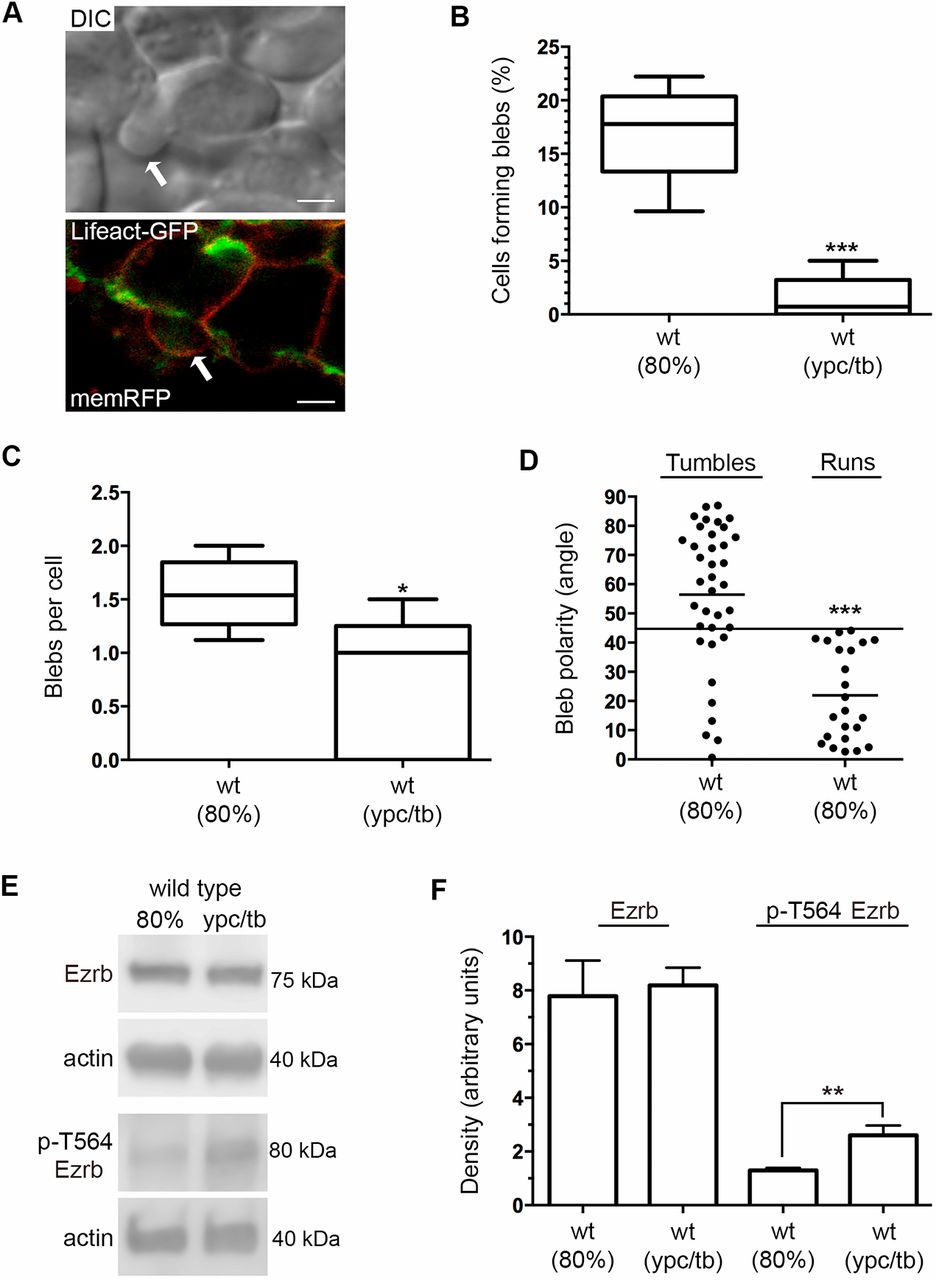
Fig. 3 Bleb protrusions at mid- and late gastrulation. (A) DIC and confocal live cell images of different lateral mesendodermal cells at 80% epiboly. Cells are labeled with Lifeact-GFP (green) and memRFP (red). Arrows indicate bleb protrusions. Scale bars: 5 µm. (B) Percentage of wild-type cells forming bleb protrusions during 15 min time-lapse imaging (wild type at 80% epiboly, n=675 cells, 5 embryos; wild type at ypc/tb, n=700 cells, 5 embryos). (C) Quantitation of blebs per cell. (D) Bleb protrusion angles (in degrees) in relation to cell movement direction during tumble and run phases (wild type, n=25 cells, 2 embryos). Long black line denotes a protrusion angle of 45°. (E) Representative western blots of total and phospho-Ezrb (T564) expression in wild-type embryos. (F) Quantitation of western blot band density normalized to β-actin (n=3 experimental replicates). Box plots (B,C) show the interquartile dataset, the median and the data range. Scatter plot (D) shows individual data points and average values. Bar graph (F) shows average values±s.d. *P<0.05, **P<0.01, ***P<0.001; unpaired Student's t-test with Welch's correction, except D (Watson non-parametric two-sample U2 test).