
Fig. 5
- ID
- ZDB-FIG-200320-19
- Publication
- Prince et al., 2019 - Dorsal convergence of gastrula cells requires a Vangl2 and adhesion protein-dependent change in protrusive activity
- Other Figures
- All Figure Page
- Back to All Figure Page
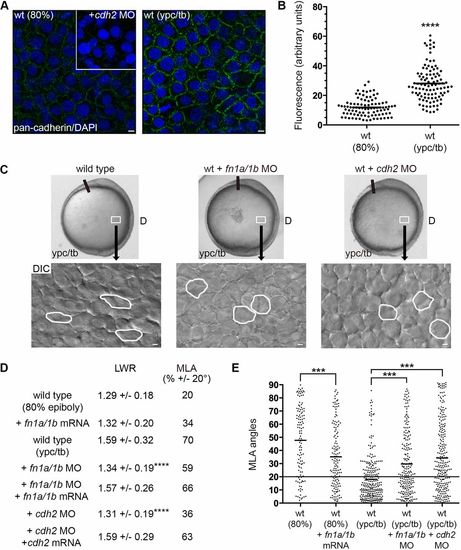
Fibronectin and Cdh2 regulate mesodermal PCP. (A,B) Greater plasma membrane expression of Cdh2 in wild-type embryos at the ypc/tb stage compared with 80% epiboly. Inset shows antibody labeling in the cdh2 morphant. (C) Live embryo and DIC control images (reproduced from Fig. 2A and Fig. 1A, respectively) of lateral mesodermal cells at the ypc/tb stage. Control and wild-type embryos injected with fn1a/1b MO and cdh2 MO. White boxes indicate approximate position of microscopic analysis. DIC images are oriented as shown in Fig. 2A, with dorsal to the right and anterior to the top. Selected cells are outlined to show elongation and alignment relative to the dorsal-ventral body axis. D, dorsal. (D) PCP quantitation of lateral mesendodermal and mesodermal cells (wild type at 80% epiboly+fn1a/1b mRNA, n=140 cells, 5 embryos; wild type at ypc/tb+fn1a/1b MO, n=211 cells, 5 embryos; wild type at ypc/tb+fn1a/1b MO+fn1a/1b mRNA, n=73 cells, 4 embryos; wild type at ypc/tb+cdh2 MO, n=238 cells, 4 embryos; wild type at ypc/tb+cdh2 MO+cdh2 mRNA, n=60 cells, 3 embryos). (E) MLA data from D depicted as individual data points (in degrees). Long black line indicates 20°. Scatter plots (B,E) show individual data points and average values. ***P<0.001, ****P<0.0001; unpaired Student's t-test with Welch's correction except E (Watson non-parametric two-sample U2 test). Scale bars: 5 µm. |