
|
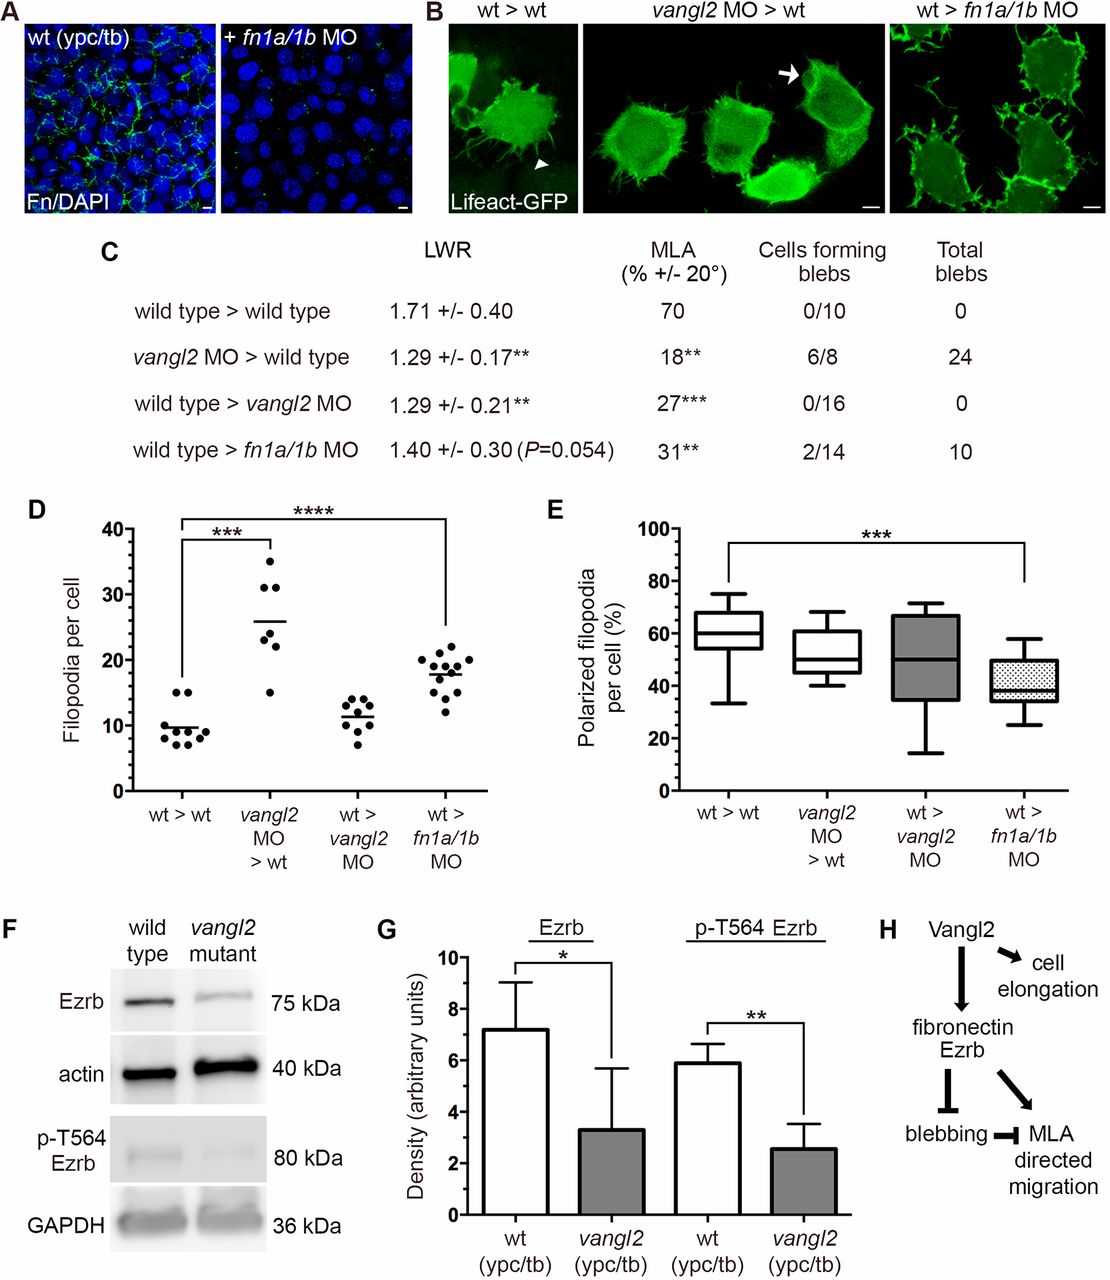
Fig. 8 vangl2 acts cell-autonomously to regulate bleb protrusive activity. (A) Wild-type control and fn1a/1b MO-injected host embryo immunolabeled using a fibronectin (Fn) antibody and stained with DAPI. (B) Lifeact-GFP labeled donor cells transplanted to host embryos (dorsal to the right). White arrowhead marks a single filopodia and white arrow indicates a bleb protrusion. (C) PCP and bleb protrusion quantitation for lateral mesodermal donor cells (wild type>wild type, n=10 cells, 5 embryos; vangl2 MO>wild type, n=8 cells, 3 embryos; wild type>vangl2 MO, n=16 cells, 6 embryos; wild type>fn1a/1b MO, n=14 cells, 4 embryos). (D,E) Donor cell filopodia protrusion number (D) and polarization in relation to the dorsal-ventral body axis (E). (F) Representative western blots of total and phospho-Ezrb (T564) expression in wild-type control and vangl2vu67/vu67 mutant embryos. (G) Quantitation of western blot band density normalized to β-actin or GAPDH (n=3 experimental replicates). (H) Summary diagram of key experimental findings. Scatter plot (D) shows individual data points and average values. Box plot (E) shows the interquartile dataset, the median and the data range. Bar graph (G) shows average values±the s.d. *P<0.05, **P<0.01, ***P<0.001, ****P<0.0001; unpaired Student's t-test with Welch's correction. Scale bars: 5 µm.