
- Title
-
Müller Glial Cells Participate in Retinal Waves via Glutamate Transporters and AMPA Receptors
- Authors
- Zhang, R.W., Du, W.J., Prober, D.A., Du, J.L.
- Source
- Full text @ Cell Rep.
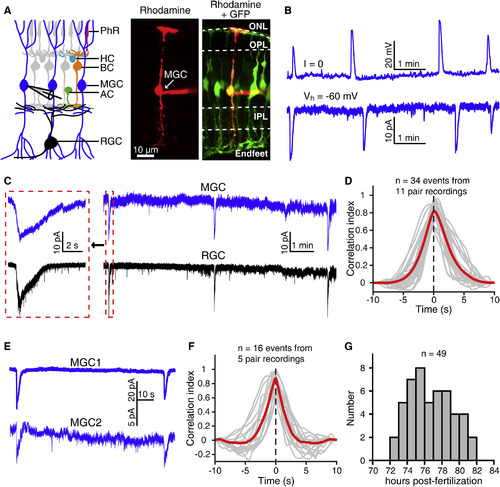
Müller Glial Cells of Zebrafish Larvae Exhibit Spontaneous Rhythmic Electrical Activities (A) Left, schematic of vertebrate retinal cellular structure. Right, confocal images showing the morphology of a Müller glial cell (MGC) when 1% rhodamine (red) was loaded into the MGC via a whole-cell recording pipette in a 3-dpf Tg(GFAP:eGFP) larva. AC, amacrine cell; BC, bipolar cell; HC, horizontal cell; IPL, inner plexiform layer; MGC, Müller glial cell; ONL, outer nuclear layer; OPL, outer plexiform layer; PhR, photoreceptor; RGC, retinal ganglion cell. (B) Spontaneous rhythmic giant activities of an MGC monitored with whole-cell recording in a 3-dpf larva under current- (top) or voltage-clamp mode (at −60 mV, bottom). (C) Correlated spontaneous giant activities between an MGC and an RGC monitored with double whole-cell recordings. Left, enlarged view of the correlated events shown in the dashed boxes. (D) Cross-correlation between MGCs’ and RGCs’ spontaneous giant activities. The 34 events obtained from 11 pairs of 1 MGC and 1 RGC were analyzed. The gray lines represent the cross-correlation of single events, and the red line indicates the average. (E) Correlated spontaneous electrical activities between two nearby MGCs monitored with double whole-cell recordings. Both cells were held at −60 mV. (F) Cross-correlation between MGCs’ spontaneous giant activities. The 16 events obtained from 5 MGC pairs were analyzed. The gray lines represent the cross-correlation of single events, and the red line indicates the average. (G) Temporal distribution of the occurrence of MGCs’ spontaneous giant electrical activities. Whole-cell recording data were obtained from 49 larvae. |
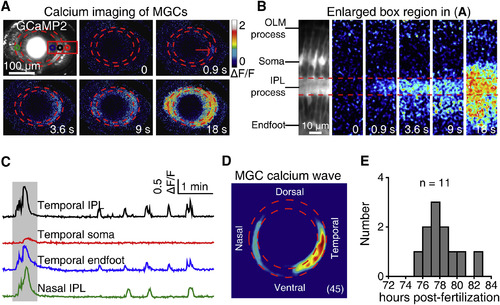
Müller Glial Cells of Zebrafish Larvae Display Spontaneous Calcium Waves (A) Pseudocolor time-lapse two-photon images showing a spontaneous calcium wave of MGCs in a 3-dpf Tg(GFAP:GCaMP2) larva. The two red dashed circles indicate the boundaries of the IPL, and the red arrow indicates the initiation site of the wave. (B) Enlarged region of the red box in (A), showing the vertical propagation from MGC processes in the IPL to their endfeet and somata. IPL, inner plexiform layer; OLM, outer limiting membrane. (C) Calcium activities of four regions of interest in (A, colored circles). The shadowed area marks the period of images shown in (A). (D) Superposition of the initiation site of 45 MGC calcium waves from 6 larvae. (E) Temporal distribution of the occurrence of spontaneous MGC calcium waves. Calcium imaging data were obtained from 11 larvae. |
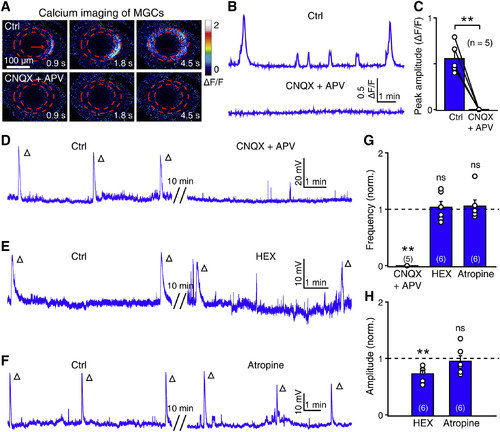
Calcium Waves of Müller Glial Cells Are Mainly Dependent on Glutamatergic Signaling (A and B) Pseudocolor images (A) and calcium activities (B) showing the effect of CNQX (50 μM) + APV (50 μM) application on MGC calcium waves. (C) Summary of data. The data obtained from the same larva are connected by a line. (D–F) Example traces showing the effect of APV (50 μM) + CNQX (50 μM, D), HEX (100 μM, E), and atropine (2 μM, F) on the wave-like electrical activities of MGCs. Each open arrowhead represents an MGC wave. (G and H) Summary of pharmacological effects on the frequency (G) and amplitude (H) of MGC waves. The numbers in the brackets and on the bars indicate the numbers of larvae examined. The two-tailed paired Student’s t test was performed for statistical analysis. ns, not significant; ∗∗p < 0.01. Data are represented as means ± SEMs. |
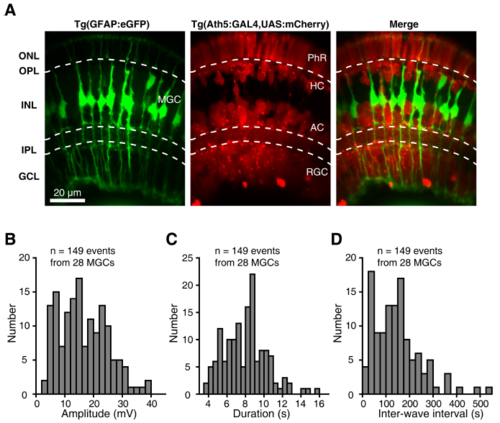
Morphology of MGCs and Characterization of MGCs’ Wave-Like Spontaneous Electrical Activities in Zebrafish Larvae, Related to Figure 1. (A) In vivo confocal images show MGCs and other retinal cells (including PhRs, HCs, ACs and RGCs) in a Tg(GFAP:eGFP,Ath5-gal4,UAS:mCherry) larva aged at 3 dpf. The top dash line indicates the location of the outer plexiform layer (OPL), and the bottom two lines indicates the boundaries of the inner plexiform layer (IPL). AC, amacrine cell; HC, horizontal cell; GCL, ganglion cell layer; INL, inner nuclear layer; MGC, Müller glial cell; ONL, outer nuclear layer; PhR, photoreceptor; RGC, retinal ganglion cell. (B-D) Distribution of the amplitude (B), duration (C), and inter-wave interval (D) of spontaneous wave-like rhythmic electrical activities from 149 events in 28 MGCs at 3 dpf. Bin sizes: 2 mV (B), 0.5 s (C), 25 s (D). |