
|
Fig. S1
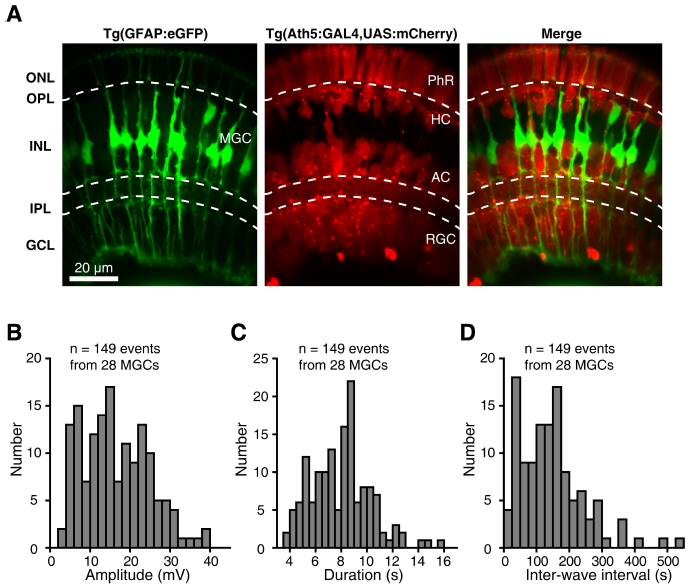
Morphology of MGCs and Characterization of MGCs’ Wave-Like Spontaneous Electrical Activities in Zebrafish Larvae, Related to Figure 1. (A) In vivo confocal images show MGCs and other retinal cells (including PhRs, HCs, ACs and RGCs) in a Tg(GFAP:eGFP,Ath5-gal4,UAS:mCherry) larva aged at 3 dpf. The top dash line indicates the location of the outer plexiform layer (OPL), and the bottom two lines indicates the boundaries of the inner plexiform layer (IPL). AC, amacrine cell; HC, horizontal cell; GCL, ganglion cell layer; INL, inner nuclear layer; MGC, Müller glial cell; ONL, outer nuclear layer; PhR, photoreceptor; RGC, retinal ganglion cell. (B-D) Distribution of the amplitude (B), duration (C), and inter-wave interval (D) of spontaneous wave-like rhythmic electrical activities from 149 events in 28 MGCs at 3 dpf. Bin sizes: 2 mV (B), 0.5 s (C), 25 s (D).