
|
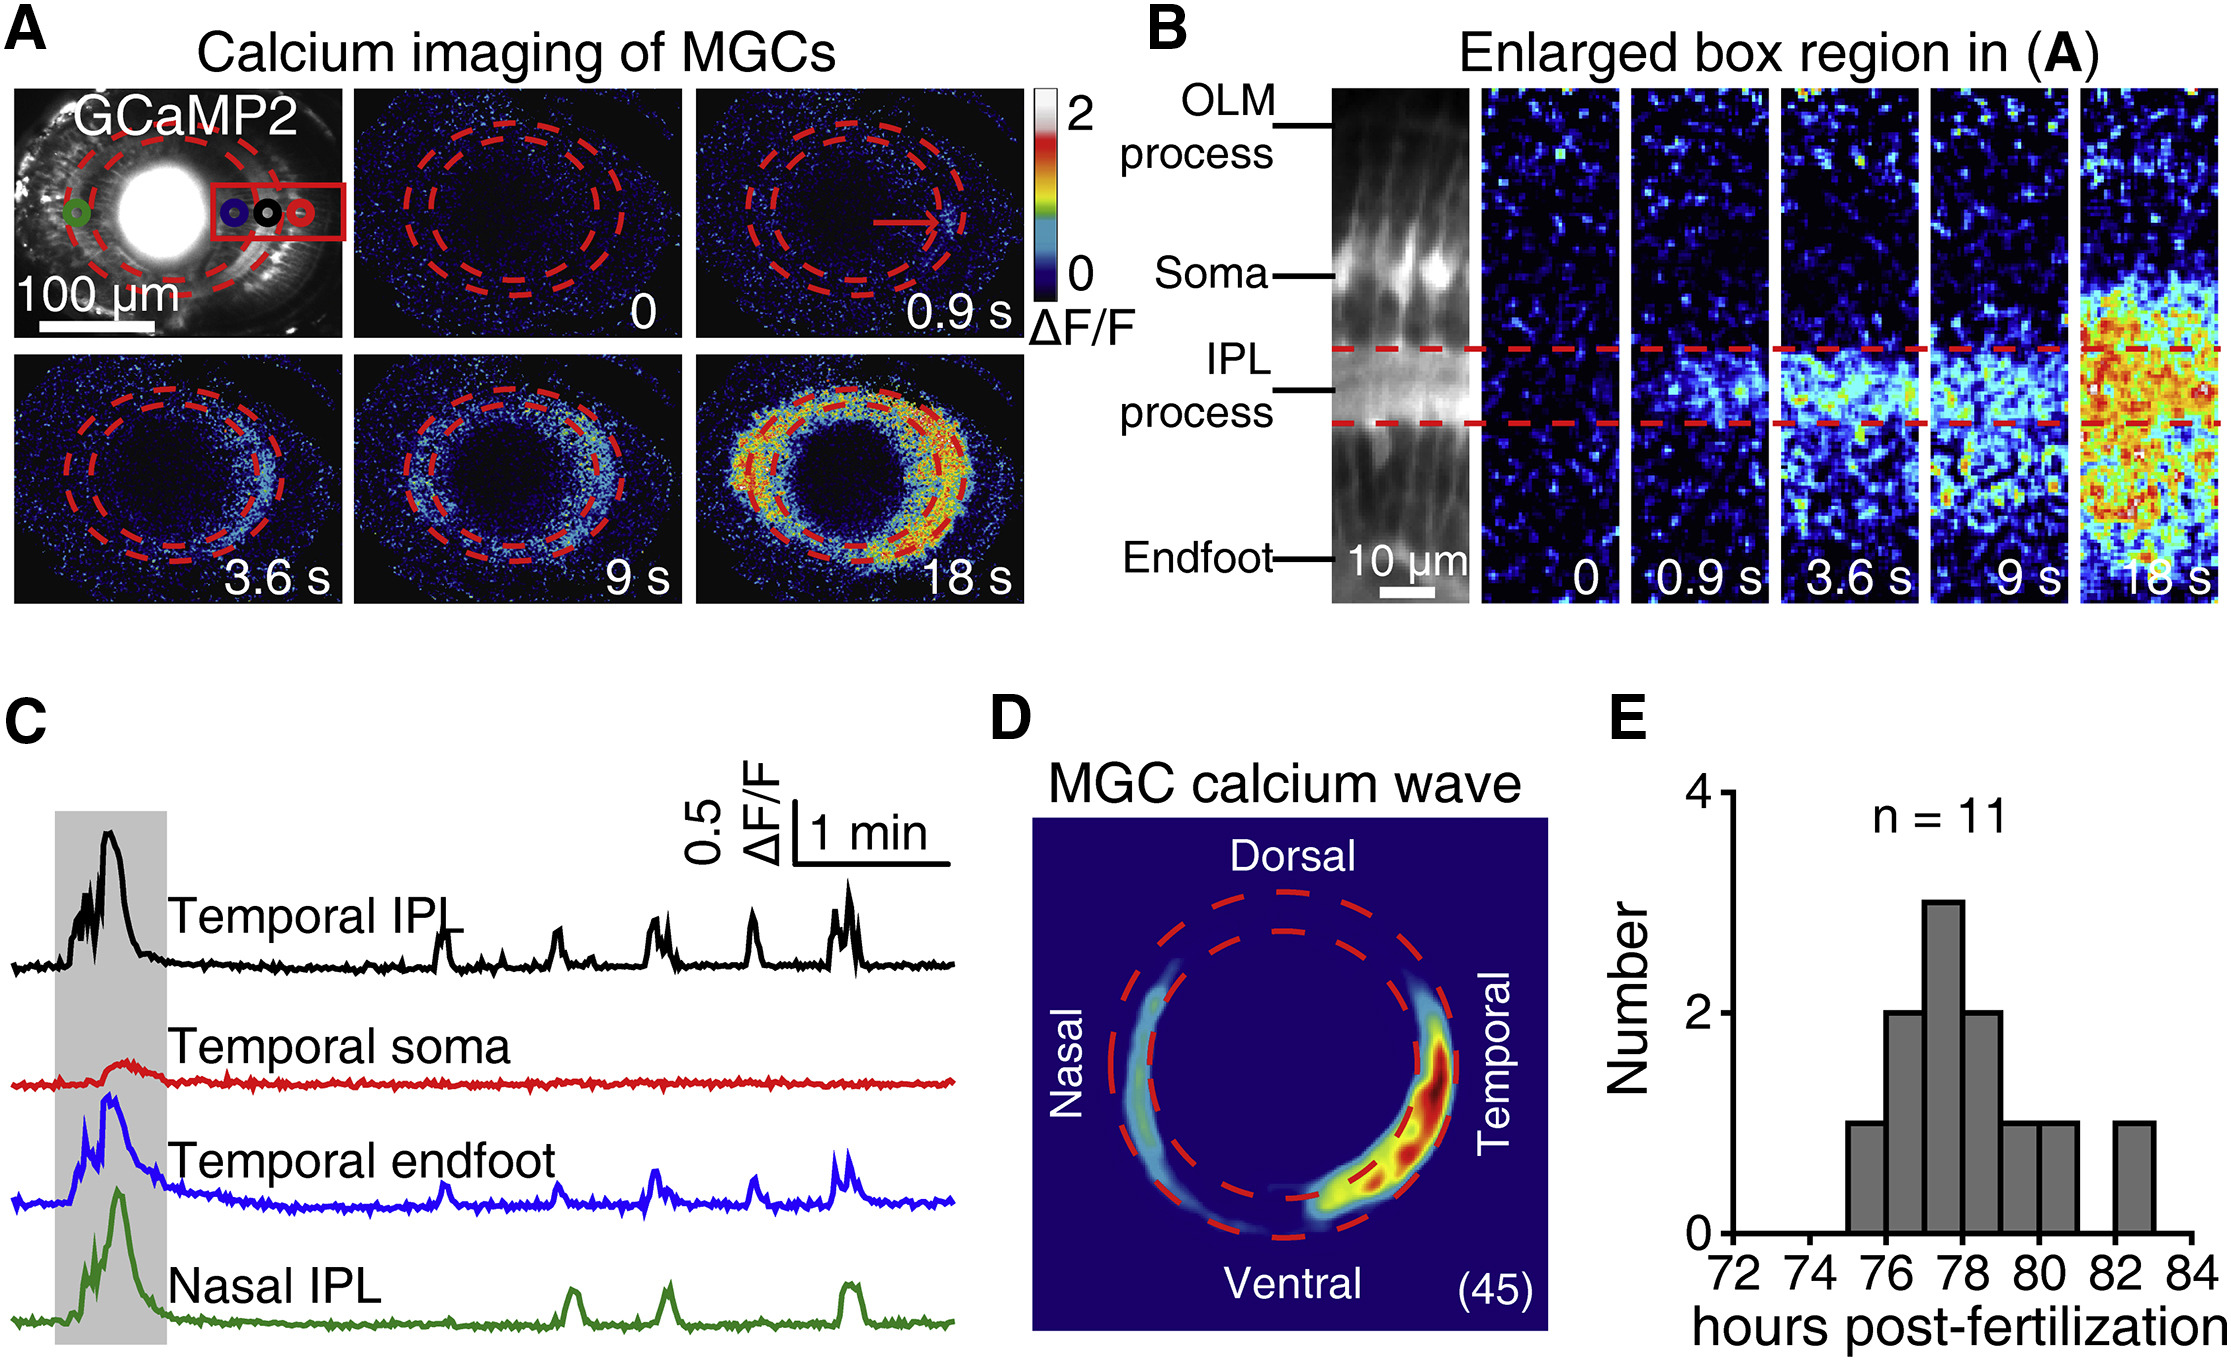
Fig. 2
Müller Glial Cells of Zebrafish Larvae Display Spontaneous Calcium Waves
(A) Pseudocolor time-lapse two-photon images showing a spontaneous calcium wave of MGCs in a 3-dpf Tg(GFAP:GCaMP2) larva. The two red dashed circles indicate the boundaries of the IPL, and the red arrow indicates the initiation site of the wave.
(B) Enlarged region of the red box in (A), showing the vertical propagation from MGC processes in the IPL to their endfeet and somata. IPL, inner plexiform layer; OLM, outer limiting membrane.
(C) Calcium activities of four regions of interest in (A, colored circles). The shadowed area marks the period of images shown in (A).
(D) Superposition of the initiation site of 45 MGC calcium waves from 6 larvae.
(E) Temporal distribution of the occurrence of spontaneous MGC calcium waves. Calcium imaging data were obtained from 11 larvae.