
|
Fig. 1
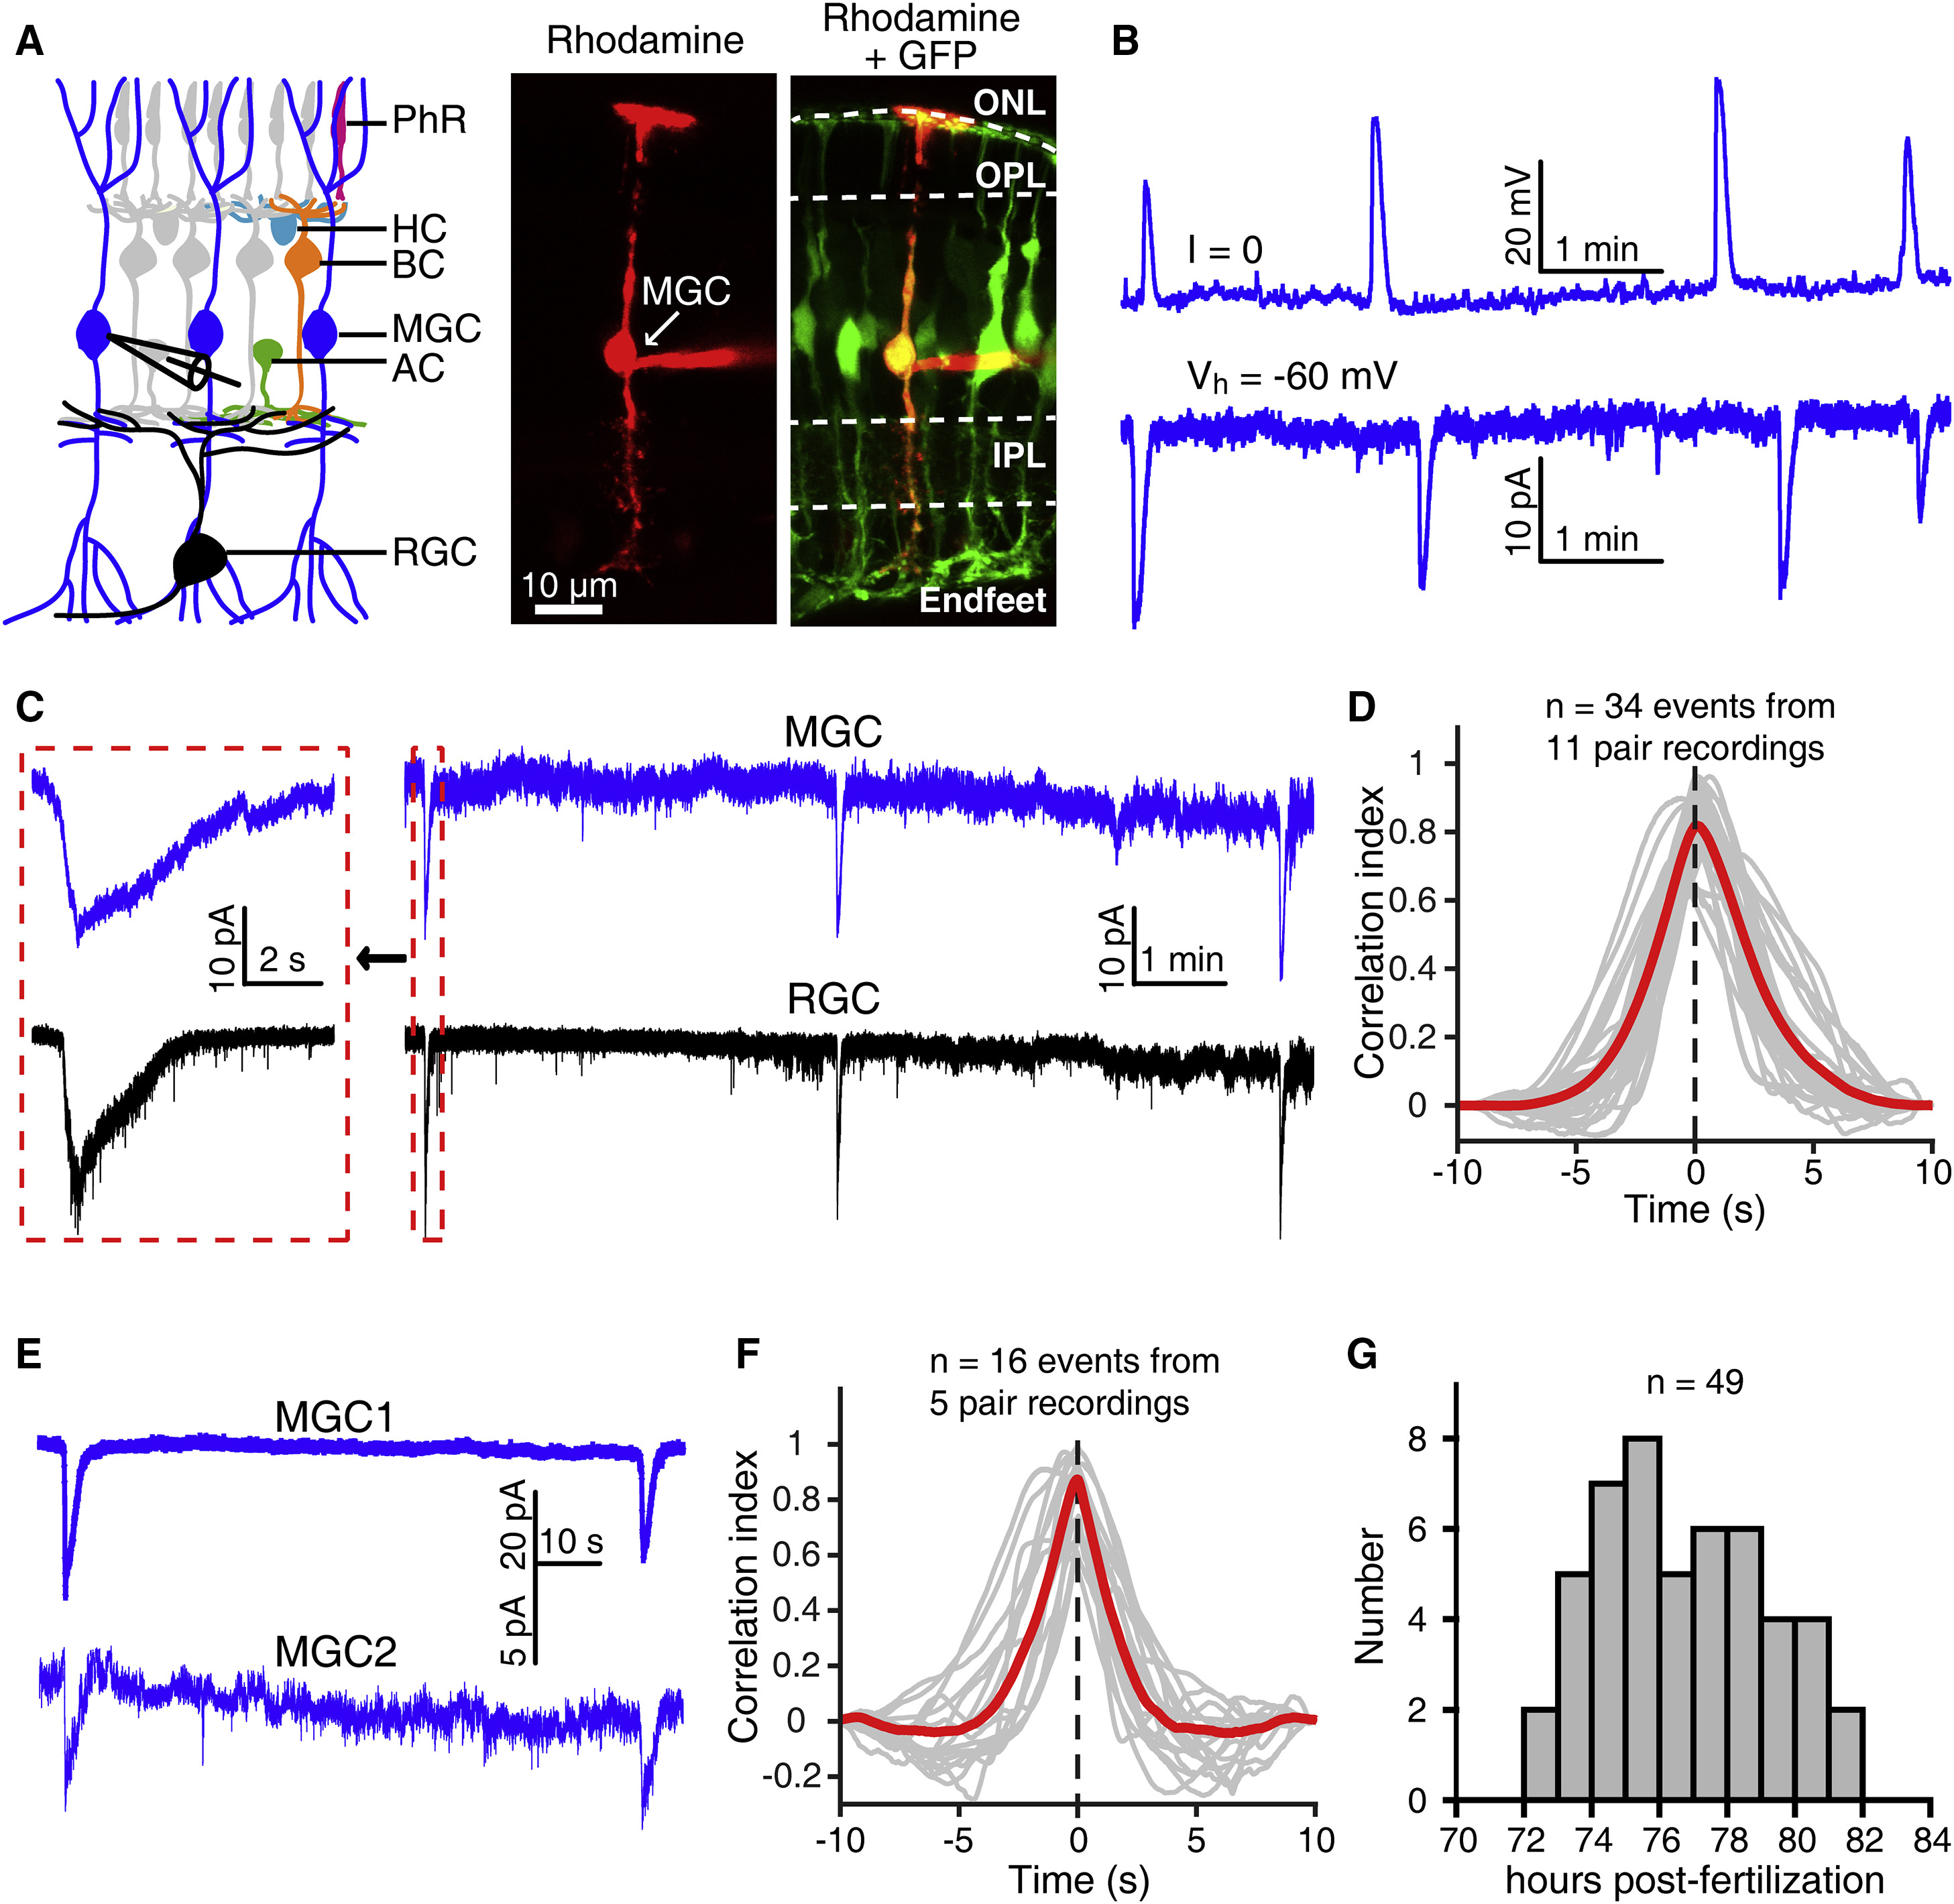
Müller Glial Cells of Zebrafish Larvae Exhibit Spontaneous Rhythmic Electrical Activities
(A) Left, schematic of vertebrate retinal cellular structure. Right, confocal images showing the morphology of a Müller glial cell (MGC) when 1% rhodamine (red) was loaded into the MGC via a whole-cell recording pipette in a 3-dpf Tg(GFAP:eGFP) larva. AC, amacrine cell; BC, bipolar cell; HC, horizontal cell; IPL, inner plexiform layer; MGC, Müller glial cell; ONL, outer nuclear layer; OPL, outer plexiform layer; PhR, photoreceptor; RGC, retinal ganglion cell.
(B) Spontaneous rhythmic giant activities of an MGC monitored with whole-cell recording in a 3-dpf larva under current- (top) or voltage-clamp mode (at −60 mV, bottom).
(C) Correlated spontaneous giant activities between an MGC and an RGC monitored with double whole-cell recordings. Left, enlarged view of the correlated events shown in the dashed boxes.
(D) Cross-correlation between MGCs’ and RGCs’ spontaneous giant activities. The 34 events obtained from 11 pairs of 1 MGC and 1 RGC were analyzed. The gray lines represent the cross-correlation of single events, and the red line indicates the average.
(E) Correlated spontaneous electrical activities between two nearby MGCs monitored with double whole-cell recordings. Both cells were held at −60 mV.
(F) Cross-correlation between MGCs’ spontaneous giant activities. The 16 events obtained from 5 MGC pairs were analyzed. The gray lines represent the cross-correlation of single events, and the red line indicates the average.
(G) Temporal distribution of the occurrence of MGCs’ spontaneous giant electrical activities. Whole-cell recording data were obtained from 49 larvae.