
Fig. 1
- ID
- ZDB-FIG-190812-1
- Publication
- Zhang et al., 2019 - Müller Glial Cells Participate in Retinal Waves via Glutamate Transporters and AMPA Receptors
- Other Figures
- All Figure Page
- Back to All Figure Page
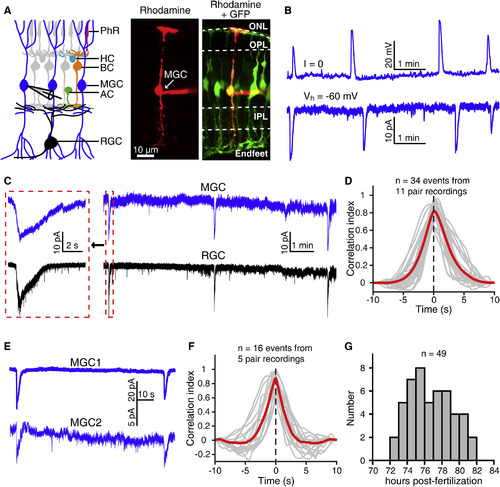
Müller Glial Cells of Zebrafish Larvae Exhibit Spontaneous Rhythmic Electrical Activities (A) Left, schematic of vertebrate retinal cellular structure. Right, confocal images showing the morphology of a Müller glial cell (MGC) when 1% rhodamine (red) was loaded into the MGC via a whole-cell recording pipette in a 3-dpf Tg(GFAP:eGFP) larva. AC, amacrine cell; BC, bipolar cell; HC, horizontal cell; IPL, inner plexiform layer; MGC, Müller glial cell; ONL, outer nuclear layer; OPL, outer plexiform layer; PhR, photoreceptor; RGC, retinal ganglion cell. (B) Spontaneous rhythmic giant activities of an MGC monitored with whole-cell recording in a 3-dpf larva under current- (top) or voltage-clamp mode (at −60 mV, bottom). (C) Correlated spontaneous giant activities between an MGC and an RGC monitored with double whole-cell recordings. Left, enlarged view of the correlated events shown in the dashed boxes. (D) Cross-correlation between MGCs’ and RGCs’ spontaneous giant activities. The 34 events obtained from 11 pairs of 1 MGC and 1 RGC were analyzed. The gray lines represent the cross-correlation of single events, and the red line indicates the average. (E) Correlated spontaneous electrical activities between two nearby MGCs monitored with double whole-cell recordings. Both cells were held at −60 mV. (F) Cross-correlation between MGCs’ spontaneous giant activities. The 16 events obtained from 5 MGC pairs were analyzed. The gray lines represent the cross-correlation of single events, and the red line indicates the average. (G) Temporal distribution of the occurrence of MGCs’ spontaneous giant electrical activities. Whole-cell recording data were obtained from 49 larvae. |