
|
Fig. 3
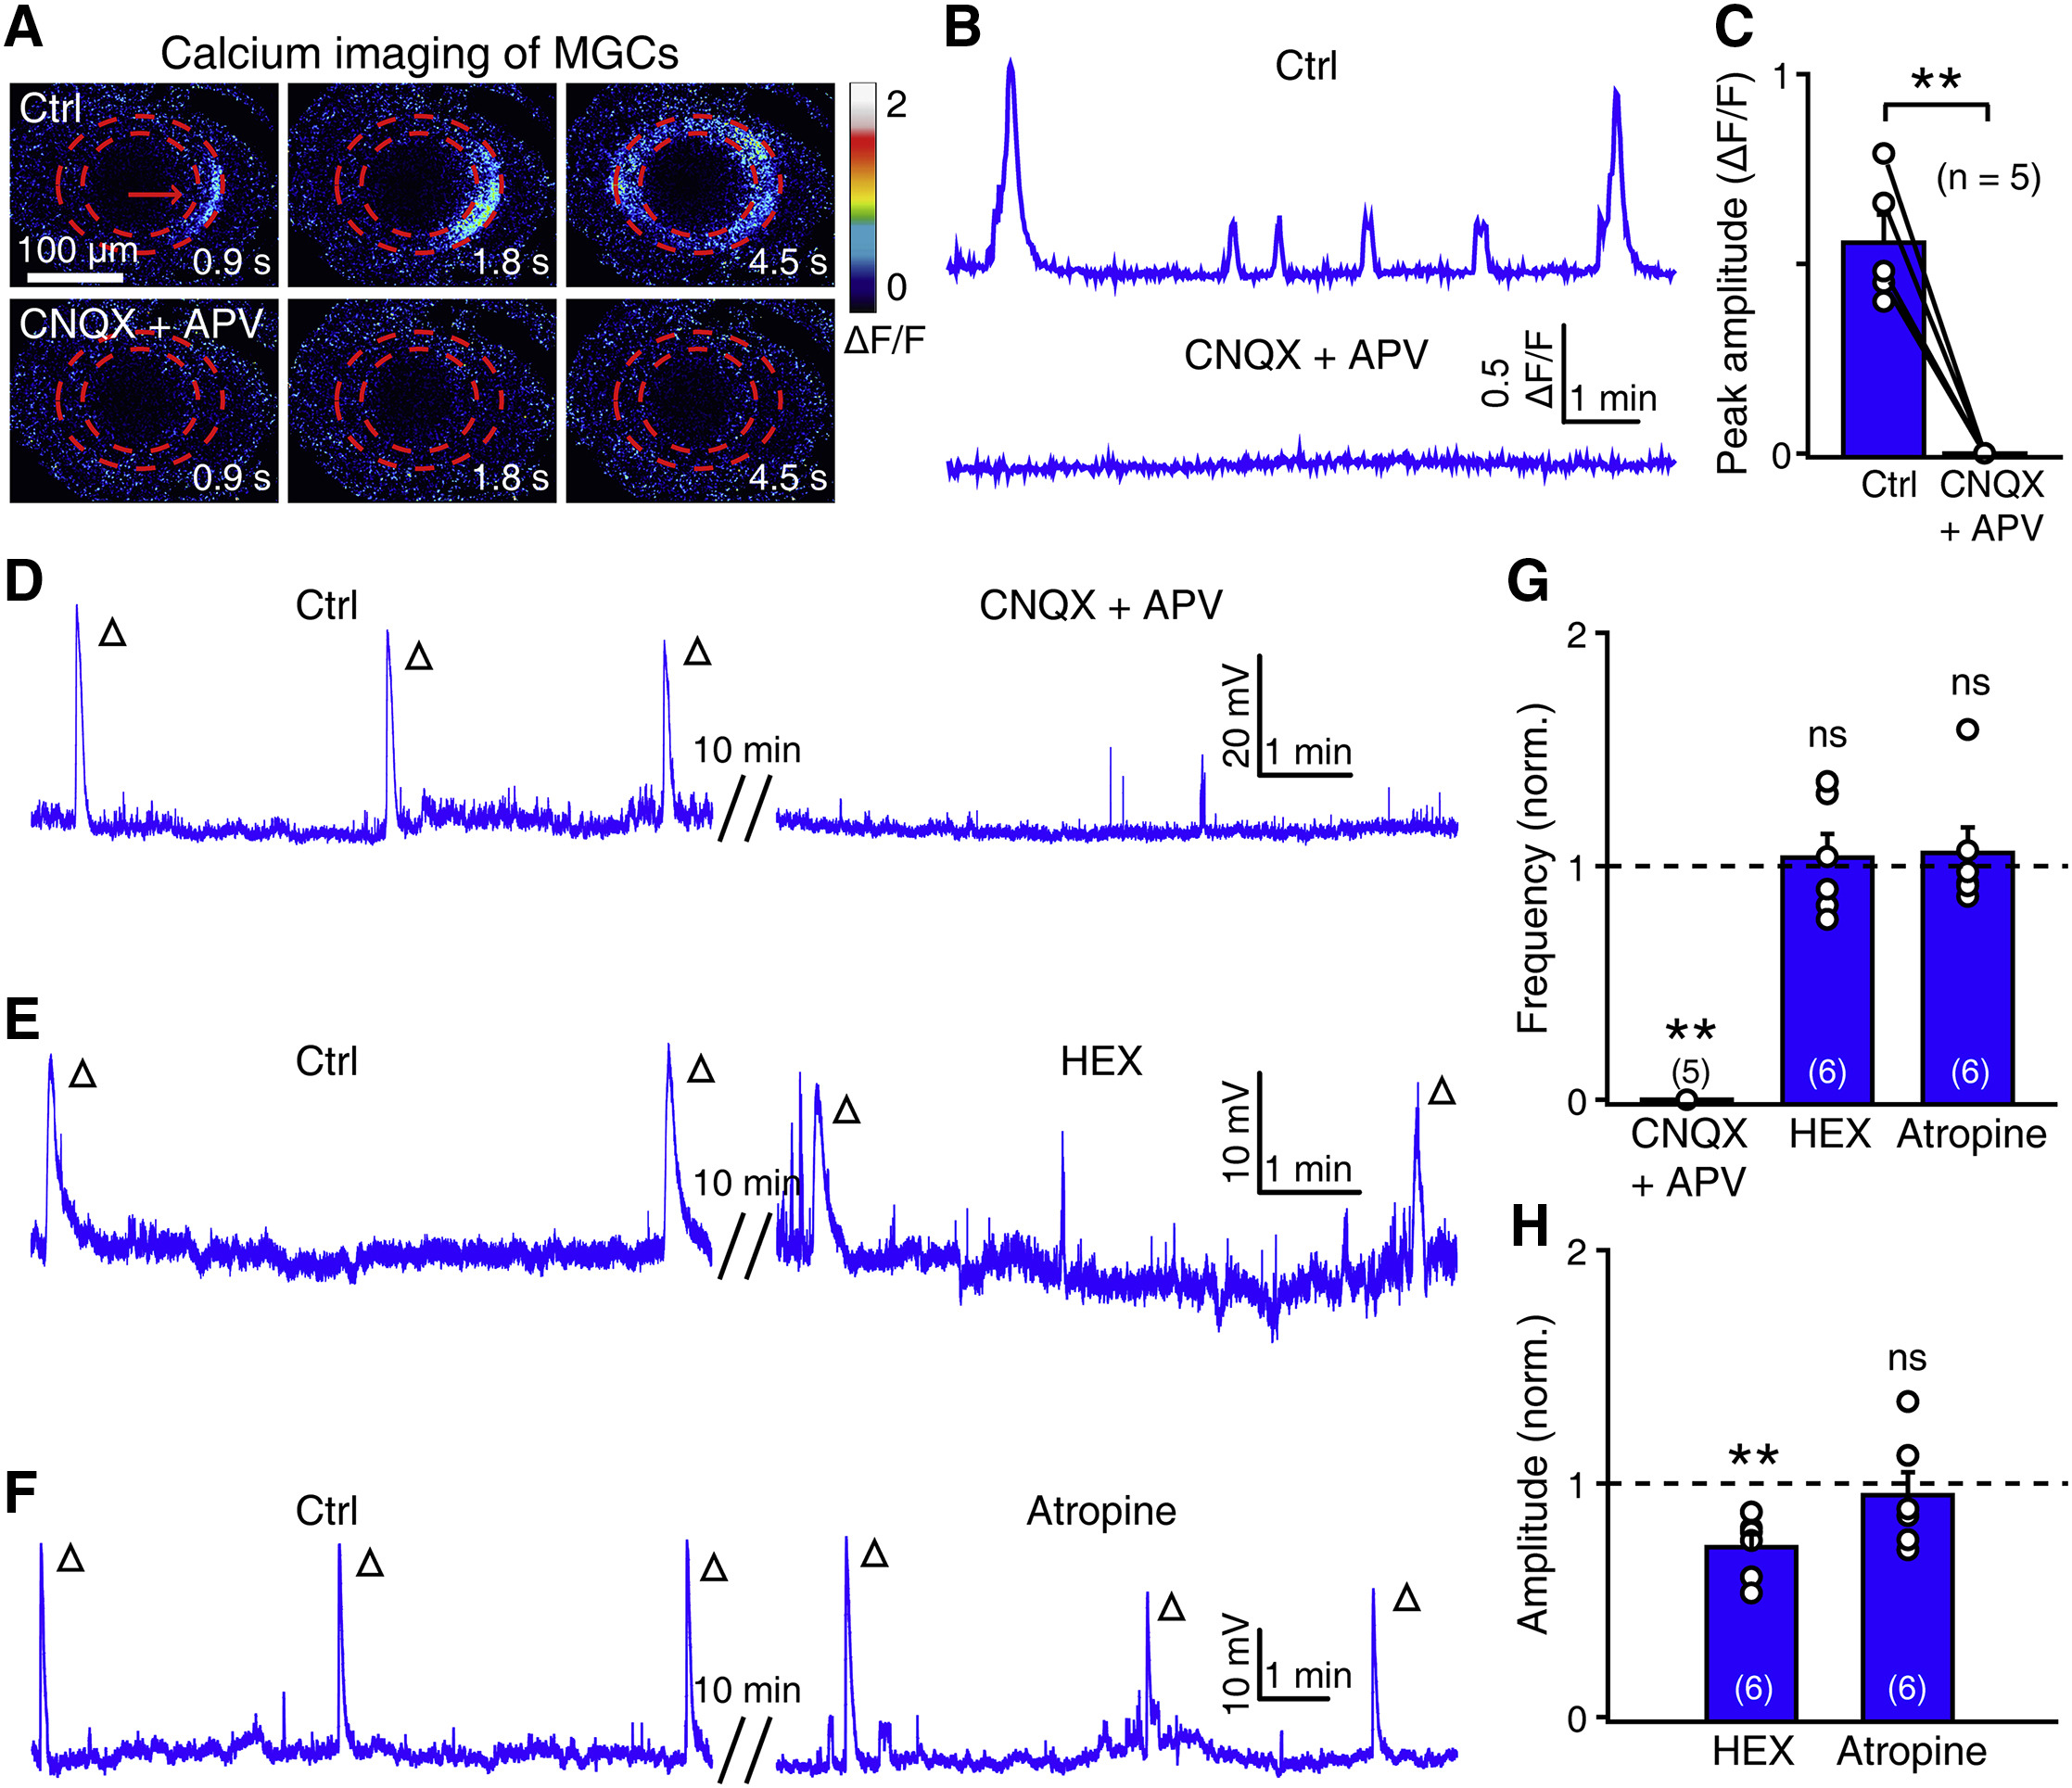
Calcium Waves of Müller Glial Cells Are Mainly Dependent on Glutamatergic Signaling
(A and B) Pseudocolor images (A) and calcium activities (B) showing the effect of CNQX (50 μM) + APV (50 μM) application on MGC calcium waves.
(C) Summary of data. The data obtained from the same larva are connected by a line.
(D–F) Example traces showing the effect of APV (50 μM) + CNQX (50 μM, D), HEX (100 μM, E), and atropine (2 μM, F) on the wave-like electrical activities of MGCs. Each open arrowhead represents an MGC wave.
(G and H) Summary of pharmacological effects on the frequency (G) and amplitude (H) of MGC waves.
The numbers in the brackets and on the bars indicate the numbers of larvae examined. The two-tailed paired Student’s t test was performed for statistical analysis. ns, not significant; ∗∗p < 0.01. Data are represented as means ± SEMs.