FIGURE SUMMARY
Title

AP endonuclease 1 (Apex1) influences brain development linking oxidative stress and DNA repair

Authors
Pei, D.S., Jia, P.P., Luo, J.J., Liu, W., Strauss, P.R.
Source
Full text @ Cell Death Dis.

Loss of Apex1 protein results in increased oxidative damage, AP sites and ROS.

a Western blot analysis of Apex1 knockdown by morpholino (MO). Upper panel, quantitative analysis of WB. Significant difference is indicated by **p< 0.01. b Increased apurinic/apyrimidinic (AP) sites relative to those in controls after Apex1 knockdown. Data represent the average of five independent experiments ± SD of the mean. Significant difference is indicated by *p< 0.05 and **p < 0.01. c Increased ROS after Apex1 knockdown detected by CM-H2DCFDA. Embryos were microinjected with control MO (panels C1) or 0.2 mM Apex1 MO (panels C2), exposed to CM-H2DCFDA to detect generalized ROS, washed and examined by fluorescence microscopy. Fluorescence was greatly increased in Apex1 knockdown embryos. Photographed at ×4 magnification. d Increased oxidative DNA damage in 24 hpf embryos after Apex1 knockdown. °G levels, detected by immunostaining with TRITC-labeled anti °G mouse monoclonal antibody. Apex1 knockdown embryos (right three embryos) and control embryos (left two embryos) were examined by fluorescence microscopy. These experiments were repeated three times with similar results. e Detection of superoxide anion using MitoSOX red (panels e1 and e2) and nitric oxide using DAF-FM acetate (panels e3 and e4). Embryos were microinjected with vehicle (panels e1 and e3) or Apex1 MO (panels e2 and e4), examined at 4 hpf by confocal microscopy and photographed at ×40 magnification. Note perinuclear mitochondria containing superoxide in Apex1 knockdown embryos (e2) and the appearance of nitric oxide in the yolk syncytial layer in occasional Apex1 knockdown embryos (e4)

EXPRESSION / LABELING:
Gene:
Fish:
Knockdown Reagent:
Anatomical Term:
Stage: Prim-5

Loss of Apex1 protein in WT embryos alters brain morphology.

a Brain abnormalities at 24 hpf after Apex1 knockdown. Embryos microinjected with Apex1 MO (KD) had enlarged forebrains, indicated with arrows. Darkfield imaging (middle panels) highlights forebrain abnormality (arrow) in KD compared with control embryos. Dorsal views of KD embryos (third panel) show abnormality of the brain ventricle in knockdown embryos relative to controls. b Abnormal ventricle space shown by Texas Red dextran depends on the concentration of Apex1 MO (0.1, 0.15, or 0.2 mM) used for knockdown. Dye was microinjected directly into the ventricle space at 24 hpf. These experiments were performed three times with similar results

PHENOTYPE:
Fish:
Knockdown Reagent:
Observed In:
Stage: Prim-5

Whole mount in situ hybridization demonstrates reduction in four key brain transcription factors after Apex1 knockdown in both wild-type and p53 mutant embryos with rescue by co-injection of mRNA for human <italic>APEX1</italic>.

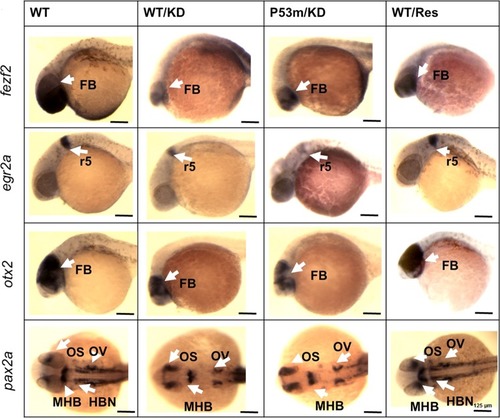
Whole mount in situ hybridization shows aberrant distribution of critical brain markers after Apex1 knockdown. Rescue was achieved by co-injection of transcript for human APEX1. Similar results were obtained in p53 mutant embryos in which Apex1 was knocked down. Whole mount in situ hybridization was performed to examine fezf2, otx2, egr2a, and pax2a expression after knockdown of Apex1 in wild-type and p53 mutant embryos. Expression of each transcription factor decreased, and distribution was altered in both Apex1 MO injected wild-type and p53 mutant embryos, but was rescued by co-injection with human APEX1 capped mRNA. Note the small heads and eyes in Apex1 knockdown embryos. Hindbrain neurons (HBN) indicated by pax2a expression were no longer visible in Apex1 MO injected embryos (pax2a panel). Alteration in distribution or amount of signals is marked with arrows or brackets. KD knock down, WT wild-type, Res Apex1MO + human Apex1 rescue, p53m p53 mutant embryos, FB forebrain, MB midbrain, r5 hindbrain rhombomere 5, OS optic stalk, MHB midbrain-hindbrain boundary, OV otic vesicle. Whole mount in situ hybridization was performed with 20 embryos/group. All embryos are shown with anterior to the left

Fluorescent immunohistochemical staining of zebrafish brain for Apex1, Polb, and Creb1.

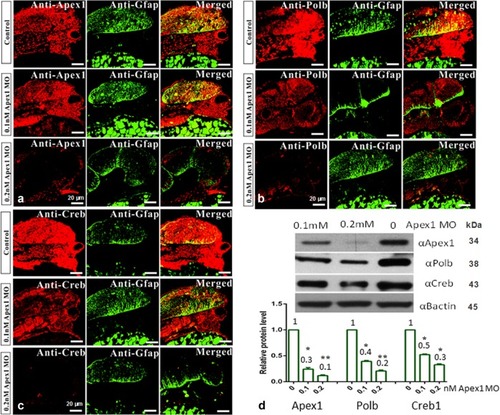
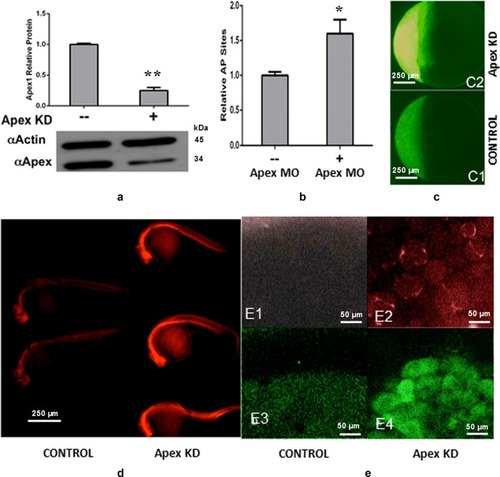
Standard fluorescent immunohistochemical staining was performed, and recorded by confocal microscopy (×40 magnification). Zebrafish embryos at the 1-cell stage were injected with control MO, 0.1, or 0.2 mM Apex1 MO, and allowed to develop for an additional 48 h before they were fixed and processed as described in Methods. Green fluorescence represents the expression pattern for glial fibrillary acidic protein (GFAP), while red fluorescence indicates the expression pattern for the indicated protein: Apex1 (a), Polb (b), or Creb1 (c), respectively (n = 20 in each group). d Western blot quantification of Apex1, Polb, or Creb1 (n = 30). Each experiment was repeated three times. Significant difference is indicated by *p< 0.05 and **p < 0.01

ZFIN is incorporating published figure images and captions as part of an ongoing project. Figures from some publications have not yet been curated, or are not available for display because of copyright restrictions.

ZFIN is incorporating published figure images and captions as part of an ongoing project. Figures from some publications have not yet been curated, or are not available for display because of copyright restrictions.

PHENOTYPE:
Fish:
Knockdown Reagent:
Observed In:
Stage: Prim-5
Acknowledgments
This image is the copyrighted work of the attributed author or publisher, and ZFIN has permission only to display this image to its users. Additional permissions should be obtained from the applicable author or publisher of the image. Full text @ Cell Death Dis.