IMAGE

Fig. 4

ID
ZDB-IMAGE-190723-1438
Genes
Source
Figures for Pei et al., 2019
Image
Figure Caption

Fig. 4 Fluorescent immunohistochemical staining of zebrafish brain for Apex1, Polb, and Creb1.

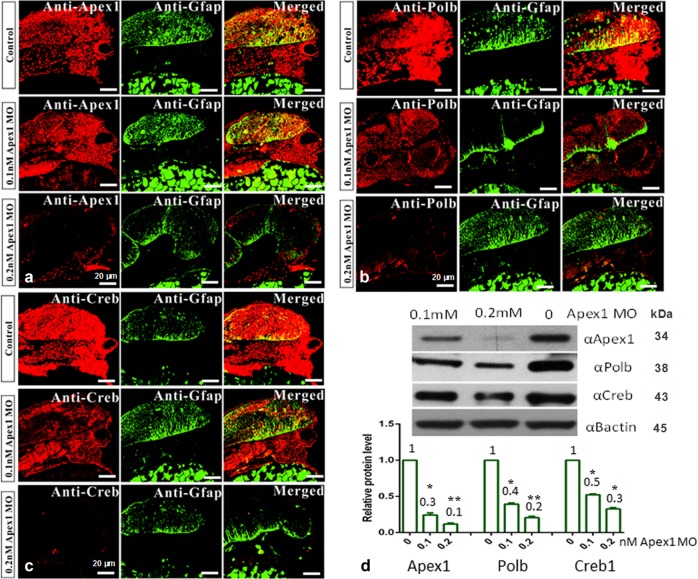
Standard fluorescent immunohistochemical staining was performed, and recorded by confocal microscopy (×40 magnification). Zebrafish embryos at the 1-cell stage were injected with control MO, 0.1, or 0.2 mM Apex1 MO, and allowed to develop for an additional 48 h before they were fixed and processed as described in Methods. Green fluorescence represents the expression pattern for glial fibrillary acidic protein (GFAP), while red fluorescence indicates the expression pattern for the indicated protein: Apex1 (a), Polb (b), or Creb1 (c), respectively (n = 20 in each group). d Western blot quantification of Apex1, Polb, or Creb1 (n = 30). Each experiment was repeated three times. Significant difference is indicated by *p< 0.05 and **p < 0.01

Figure Data
Acknowledgments
This image is the copyrighted work of the attributed author or publisher, and ZFIN has permission only to display this image to its users. Additional permissions should be obtained from the applicable author or publisher of the image. Full text @ Cell Death Dis.