- Title
-
Endocardial Notch Signaling Promotes Cardiomyocyte Proliferation in the Regenerating Zebrafish Heart through Wnt Pathway Antagonism
- Authors
- Zhao, L., Ben-Yair, R., Burns, C.E., Burns, C.G.
- Source
- Full text @ Cell Rep.
|
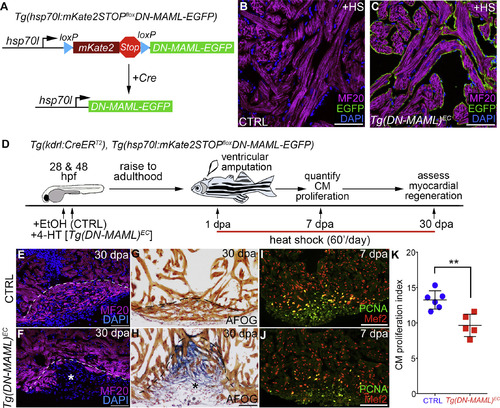
Endocardial Notch Signaling Is Required for Cardiomyocyte Proliferation during Zebrafish Heart Regeneration (A) Schematic diagram of the transgene, and its Cre-dependent recombination, used to achieve tissue-specific, heat shock-inducible inhibition of Notch signaling. (B and C) Single confocal slices of cardiac sections from Tg(kdrl:CreERT2), Tg(hsp70l:mKate2STOPfloxDN-MAML) animals treated during embryogenesis with EtOH (CRTL) (B) or 4-HT (Tg(hsp70l:DN-MAML)EC; abbreviated Tg(DN-MAML)EC) (C), raised to adulthood, heat shocked once, and sacrificed 5 hr later for analysis. Sections were double immunostained for MF20 (magenta) and GFP (green) and counterstained with DAPI (blue). Greater than three sections from more than 5 hearts per group were examined. Little to no variation was observed. (D) Double-transgenic strain and experimental strategy employed to inhibit Notch signaling specifically in endocardial cells during zebrafish heart regeneration. (E–J) Cardiac sections from kdrl:CreERT2, hsp70l:mKate2STOPfloxDN-MAML animals treated during embryogenesis with EtOH (CRTL) (E, G, and I) or 4-HT (Tg(hsp70l:DN-MAMLEC); abbreviated Tg(DN-MAML)EC) (F, H, and J), raised to adulthood, subjected to ventricular apex amputation, and heat shocked daily. (E and F) Single confocal slices of cardiac sections from 30 days post-amputation (dpa) animals immunostained for MF20 (magenta) and counterstained with DAPI (blue). Dashed lines approximate the amputation planes. The asterisk in (F) highlights a gap in the myocardial wall. (G and H) Cardiac sections from 30 dpa animals stained with AFOG to detect muscle (brown), fibrin (red), and collagen (blue). The asterisk in (H) highlights collagen-rich scar tissue (H). Myocardial regeneration occurred in 10/10 CTRL and 1/16 Tg(DN-MAML)EChearts. (I and J) Compound microscopic images of cardiac sections from 7 dpa CTRL and Tg(DN-MAML)EC animals double immunostained to detect cardiomyocyte nuclei (α-Mef2 antibody; red) and cycling cells (α-PCNA antibody; green). (K) Bar graph showing cardiomyocyte proliferation indices on 7 dpa in CTRL (n = 6) and Tg(DM-MAML)EC (n = 5) hearts. Proliferation data were collected for 4–6 sections per heart and averaged to generate each data point. Statistical significance was determined using a Student’s t test. Error bars: ±1 SD. ∗∗p < 0.01. Scale bars: 50 μm. |
|
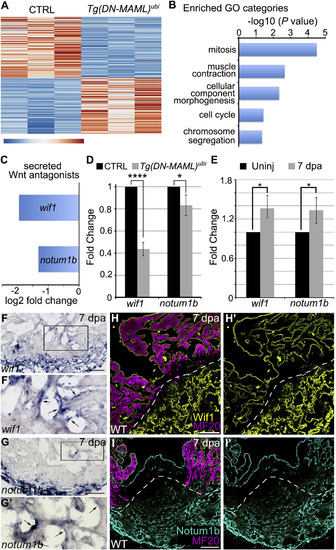
Identification of Secreted Wnt Signaling Antagonists as Candidate Notch Targets in the Endocardium during ZebrafishHeart Regeneration (A) Heatmap showing 254 differentially expressed genes (p < 0.0001) in wild-type (CTRL; n = 3 replicates) and Tg(hsp70l:DN-MAML) (n = 3 replicates) hearts on 5 dpa with daily heat shocking. (B) Bar graph showing −log10 p values for GO terms significantly overrepresented in the downregulated gene category. (C) Bar graph showing the log2 fold-change values for transcripts encoding wif1 and notum1b from (A). (D) Bar graph showing the relative expression levels of wif1 and notum1b in hearts of CTRL and hsp70l:DN-MAML animals on 5 dpa with daily heat shocking as measured by qPCR. (E) Bar graph showing the relative expression levels of wif1 and notum1b in hearts of wild-type animals without injury and on 7 dpa as measured by qPCR. (D and E) 3 technical replicates of each of 3 biological replicates were performed. Statistical significance was determined using a Student’s t test. Error bars: ±1 SD. ∗∗∗∗p < 0.0001. ∗p < 0.05. (F–G′) In situ hybridization for wif1 and notum1b in cardiac sections of wild-type hearts on 7 dpa. Boxed regions in (F) and (G) are enlarged in (F′) and (G′). Arrowheads highlight endocardial signals. 6–8 sections from 4–6 hearts were analyzed. Little to no variation was observed. (H–I′) Immunohistochemical analysis of Wif1 (H and H′; yellow) and Notum (I and I′; cyan) in cardiac sections of wild-type hearts on 7 dpa costained with the MF20 antibody (magenta) to visualize myocardium. Single confocal slices are shown. Dashed lines highlight approximate amputation planes. 6–8 sections from 4–6 hearts were analyzed. Little to no variation was observed. Scale bars: 50 μm. |
|
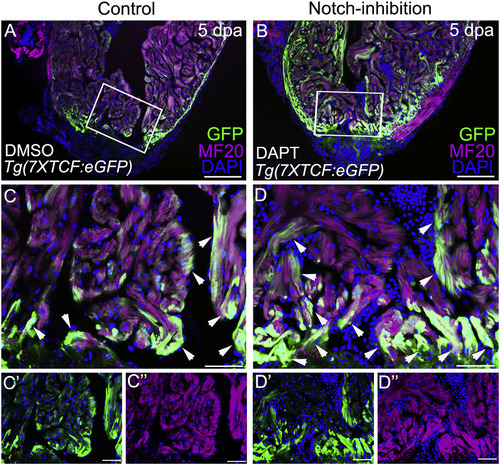
Notch Inhibition Boosts Wnt Signaling in the Myocardium of Injured Zebrafish Hearts (A and B) Confocal slices of cardiac sections from 5 dpa Tg(7xTCF:eGFP) animals injected daily with DMSO (A) or N-[N-(3,5-Difluorophenacetyl)-L-alanyl]-S-phenylglycine t-butyl ester (DAPT) (B). Animals were double immunostained to detect GFP (green) and myocardium (MF20 antibody; magenta) and counterstained with DAPI (blue). (C–D″) Boxed regions in (A) and (B) are shown at higher magnification in (C) and (D). Split channels are shown in (C′), (C″), (D′), and (D″). Arrows point to myocardial cells with active Wnt signaling. n = 3 hearts per experimental group. At least 3 sections were examined per heart. Little to no variability was observed between animals in each experimental group. |
|
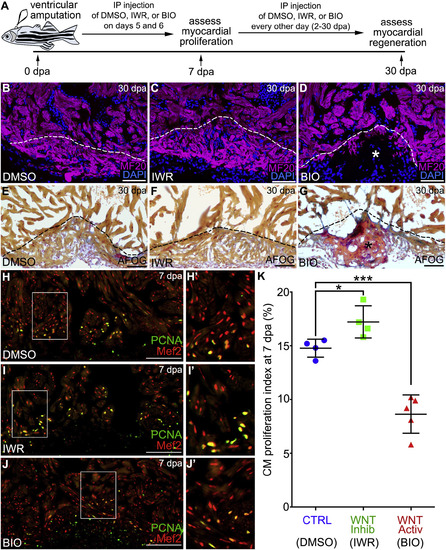
Inhibition of Wnt Signaling Is Required for ZebrafishHeart Regeneration by Bolstering Myocardial Proliferation (A) Experimental strategy used to inhibit or augment Wnt signaling during the regenerative window. Injured animals were injected intraperitoneally (IP) with DMSO, IWR, or BIO on 5 and 6 dpa before cardiomyocyte proliferation was measured on 7 dpa. Myocardial regeneration was examined on 30 dpa followed by IP injection of DMSO, IWR, or BIO every other day throughout 2–30 dpa. (B–G) Cardiac sections from 30 dpa wild-type animals injected with DMSO (B and E), IWR (C and F), or BIO (D and G). Single confocal slices of sections immunostained with MF20 (magenta) and counterstained with DAPI (blue) are shown in (B)–(D). Sections stained with AFOG to visualize muscle (brown), fibrin (red), and collagen (blue) are shown in (E)–(G). Asterisks in (D) and (G) highlight gaps in the myocardial wall filled with collagen-rich scar tissue. Heart regeneration occurred in 7/8 DMSO-treated, 4/7 IWR-treated, and 2/8 BIO-treated animals. (H–J′) Cardiac sections from 7 day post-amputation wild-typeanimals treated with DMSO (H and H′), IWR (I and I′), and BIO (J and J′) were double immunostained to detect cardiomyocyte nuclei (Mef2 antibody; red) and cycling cells (α-PCNA antibody; green). Compound microscopic images are shown. (K) Bar graph showing cardiomyocyte proliferation indices for the indicated experimental groups (DMSO, n = 4; IWR, n = 4; BIO, n = 5). 4–6 sections per heart were analyzed and averaged to generate each data point. Statistical significance was determined using a Student’s t test. Error bars: ±1 SD. ∗p < 0.05. ∗∗∗p < 0.001. Scale bars: 50 μm. |
|
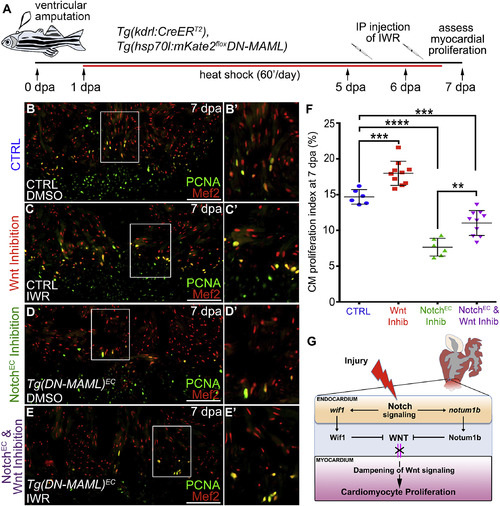
Wnt Inhibition Partially Rescues CardiomyocyteProliferation Deficits Caused by Impaired Endocardial Notch Signaling (A) Double-transgenic strain and schematic diagram of experimental timeline used to inhibit Wnt signaling in animals with compromised endocardial Notch signaling. (B–E′) Compound microscopic images of cardiac sections from kdrl:CreERT2, hsp70l:mKate2STOPfloxDN-MAML animals treated during embryogenesis with EtOH (CTRL) (B–C′) or 4-HT (hsp70l:DN-MAMLEC) (D–E′), raised to adulthood, and subjected to ventricular apex amputation. Thereafter, animals were heatshocked daily and treated with DMSO (B, B′, D, and D′) or the Wnt inhibitor IWR-1 (C, C′, E, and E′) before cardiomyocyte proliferation analysis on 7 dpa. Sections were double immunostained to detect cardiomyocyte nuclei (Mef2 antibody; red) and cycling cells (PCNA antibody; green). Boxed regions in (B), (C), (D), and (E) are enlarged in (B′), (C′), (D′), and (E′). (F) Bar graph showing the cardiomyocyte proliferation indices for the indicated experimental groups (CTRL, n = 6; Wnt Inhib, n = 10; NotchEC Inhib, n = 6; NotchEC and Wnt Inhib, n = 10). 4–6 sections per heart were analyzed and averaged to generate each data point. Statistical significance was determined using a Student’s t test. Error bars: ±1 SD. ∗∗∗p < 0.001. ∗∗∗∗p < 0.0001. ∗∗p < 0.01. Scale bars: 50 μm. (G) Schematic diagram showing the influence of endocardial Notch on Wnt signaling and cardiomyocyte proliferation. |
|
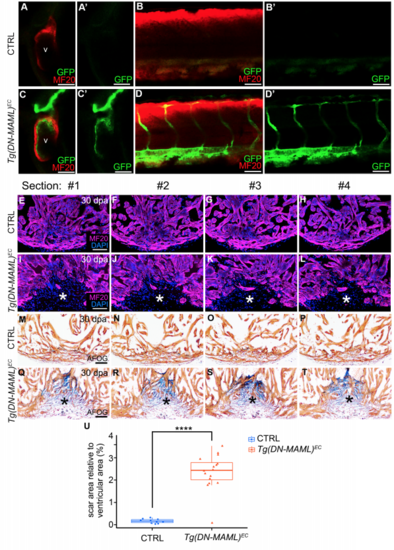
Endocardial Notch signaling is required for zebrafish heart regeneration. Related to Figure 1. (A-D”) Single confocal slices of the hearts (A-A”,C- C”) and tails (B-B”,D-D”) of Tg(kdrl:CreERT2), Tg(hsp70l:mKate2STOPfloxDN-MAML)animals after treatment with EtOH (CTRL; A-B”) or 4-HT [C-D”; Tg(hsp70l:DN-MAML)EC, abbreviated Tg(DN-MAML)EC] between 20 and 40 hours post-fertilization (hpf), heat shocking for 45 minutes at 45 hpf, 5 hours of recovery, and co-immunostaining to detect striated muscle (MF20 antibody; red) and GFP (green). Lateral views, anterior left. n=6 per group. Little to no variation was observed between animals within each experimental group. (E-L) Single confocal slices of histological sections surrounding those shown in Fig. 1E (E-H) and Fig. 1F (I-L) immunostained to detect myocardium (MF20 antibody; magenta) and counterstained with DAPI (blue). The asterisks in (I-L) highlight gaps in the myocardial wall. (M-T) Brightfield images of histological sections surrounding those shown in Fig. 1G (M-P) and Fig. 1H (Q-T) stained with AFOG to detect muscle (brown), fibrin (red), and collagen (blue). The asterisks in (Q-T) highlight collagen-rich scar tissue. (U) Box and whisker plot showing the percentages of total ventricular area occupied by scar tissue in 30 days post amputation CTRL (M-P; n=10) and Tg(DM-MAML)EC (Q-T; n=16) hearts. Scar percentage data were collected for 6-10 sections per heart and averaged to generate each data point. Statistical significance was determined using a Student’s t-test. ****, p<0.0001. Scale bars=50 μm. |
|
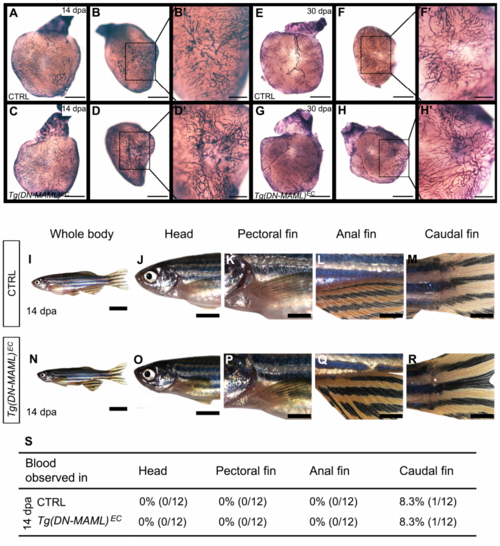
Lack of vascular endothelial phenotypes in injured Tg(DN-MAML)ECanimals. Related to Figure 1. (A-H’) Brightfield images of dissected hearts from 14 days post amputation (dpa) (A-D’) and 30 dpa (E-H’) control (CTRL; A-B’,E-F’) andTg(DN-MAML)EC (C-D’,G-H’) animals stained with alkaline phosphatase to detect neovascularization of the wound region. Lateral views of the hearts are shown in (A,C,E,G). Apex views of the wound regions are shown at lower (B,D,F,H) and higher (B’,D’,F’,H’) magnification. n=12 for both groups of 14 dpa animals. n=10 for 30 dpa CTRL group. n=11 for 30 dpa Tg(DN-MAML)EC group. Little to no variability was observed between animals in each experimental group. (I-R) Brightfield images of 14 dpa CTRL (I-M) and Tg(DM-MAML)EC (N-R) animals and higher magnification images of their heads (J,O), pectoral fins (K,P), anal fins (L,Q), and caudal finds (M,R). (S) Table showing the percentages of animals in each experimental group with signs of abnormal bleeding in the head or fins (including at their base). n=12 for both experimental groups. Scale bars=500μm for (A-D,E-H), 200μm for (B’,D’,F’,H’), 8mm for (I,N), 4mm for (J,O) and 2mm for (K-M,P-R). |
|
Single confocal slices of |
|
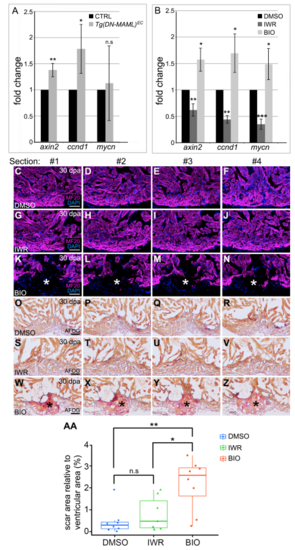
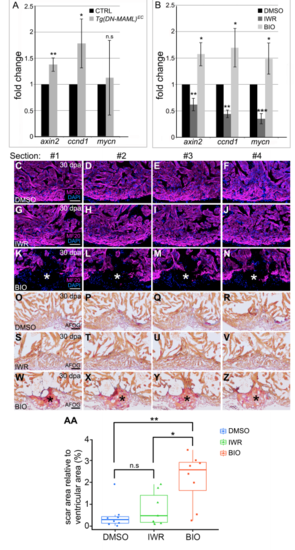
Hyperactivation of Wnt signaling impairs zebrafish heart regeneration. Related to Figure 3. (A) Bar graph showing the relative expression levels of the Wnt target genes axin2, ccnd1 and mycn in spared tissue (blue box shown in Fig. S5A) of CTRL and Tg(DM-MAML)EC animals on 5 days post amputation (dpa) as determined by qPCR. (B) Bar graph showing the relative expression levels of axin2, ccnd1 and mycn in ventricles of wild-type animals injected intraperitoneally with DMSO, the Wnt inhibitor IWR, or the WNT activator BIO as determined by qPCR. For (A) and (B), three biological and technical replicates were analyzed. Statistical significance was determined using a Student’s t- test, n.s., not significant. **, p<0.01. *,p<05. ***,p<0.001. (C-N) Single confocal slices of sections surrounding those shown in Fig. 3B (C-F), Fig. 3C (G-J), and Fig. 3D (K-N). immunostained to detect myocardium (MF20 antibody; magenta) and counterstained with DAPI (blue). The asterisks in (K-N) highlight gaps in the myocardial wall. (O-Z) Brightfield images of sections surrounding those shown in Fig. 3E (O-R), Fig. 3F (S-V), and Fig. 3G (W-Z) stained with AFOG to detect muscle (brown), fibrin (red), and collagen (blue). The asterisks in (W-Z) highlight collagen-rich scar tissue. (AA) Box and whisker plot showing the percentages of total ventricular area occupied by scar tissue in 30 dpa wild-type animals injected with DMSO (n=8), IWR (n=7), and BIO (n=8). Scar percentage data were collected for 6-10 sections per heart and averaged to generate each data point. Statistical significance was determined using a Student’s t- test. Error bars = ± 1 SD. n.s, not significant. **, p<0.01. *,p<0.05. Scale bars=50μm. |

