
|
Fig. S2
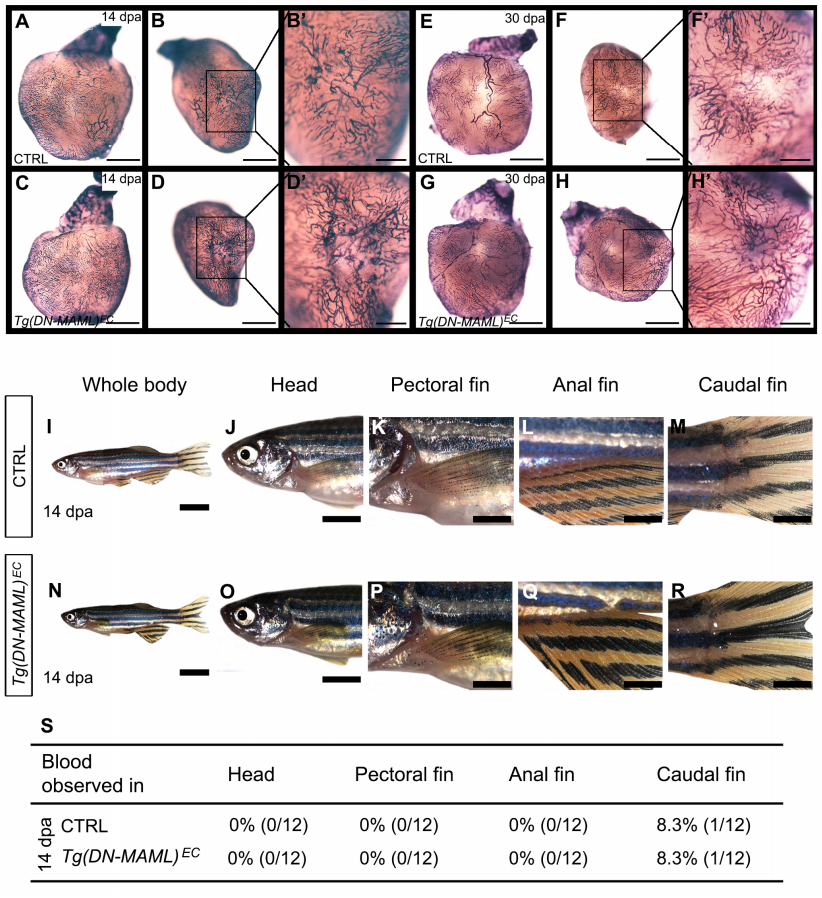
Lack of vascular endothelial phenotypes in injured Tg(DN-MAML)ECanimals. Related to Figure 1. (A-H’) Brightfield images of dissected hearts from 14 days post amputation (dpa) (A-D’) and 30 dpa (E-H’) control (CTRL; A-B’,E-F’) andTg(DN-MAML)EC (C-D’,G-H’) animals stained with alkaline phosphatase to detect neovascularization of the wound region. Lateral views of the hearts are shown in (A,C,E,G). Apex views of the wound regions are shown at lower (B,D,F,H) and higher (B’,D’,F’,H’) magnification. n=12 for both groups of 14 dpa animals. n=10 for 30 dpa CTRL group. n=11 for 30 dpa Tg(DN-MAML)EC group. Little to no variability was observed between animals in each experimental group. (I-R) Brightfield images of 14 dpa CTRL (I-M) and Tg(DM-MAML)EC (N-R) animals and higher magnification images of their heads (J,O), pectoral fins (K,P), anal fins (L,Q), and caudal finds (M,R). (S) Table showing the percentages of animals in each experimental group with signs of abnormal bleeding in the head or fins (including at their base). n=12 for both experimental groups. Scale bars=500μm for (A-D,E-H), 200μm for (B’,D’,F’,H’), 8mm for (I,N), 4mm for (J,O) and 2mm for (K-M,P-R).