
|
Fig. 1
Endocardial Notch Signaling Is Required for Cardiomyocyte Proliferation during Zebrafish Heart Regeneration
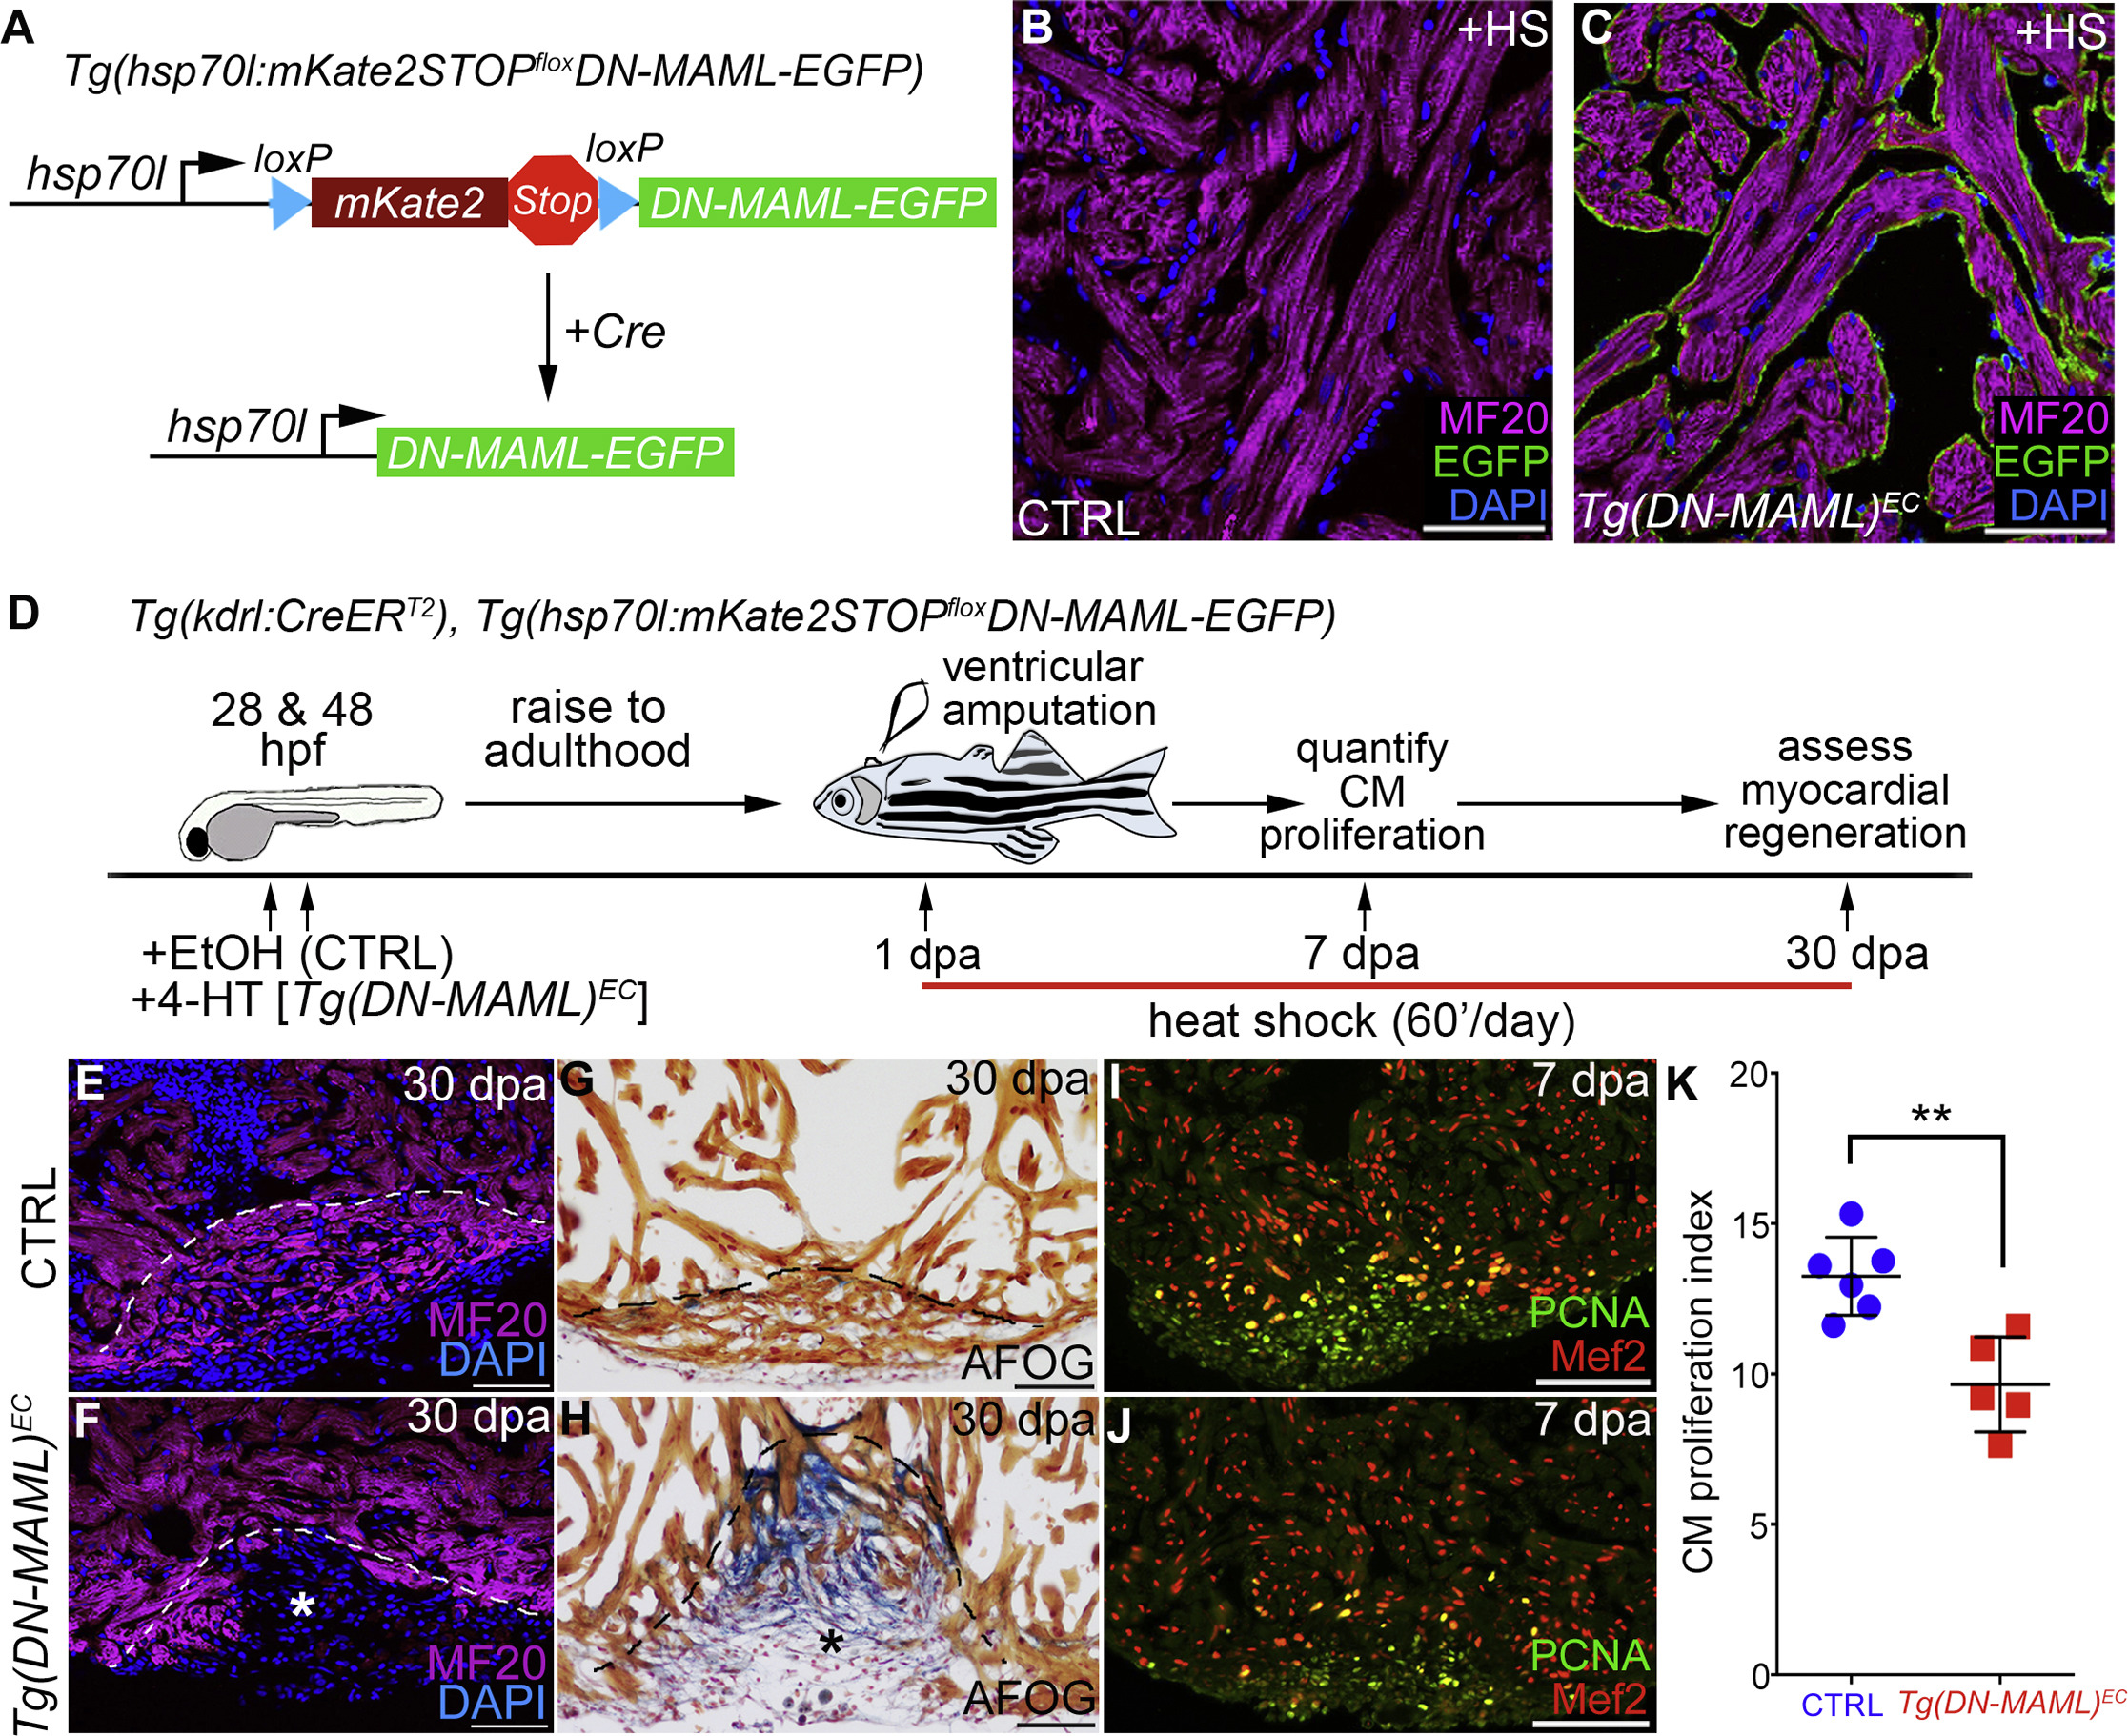
(A) Schematic diagram of the transgene, and its Cre-dependent recombination, used to achieve tissue-specific, heat shock-inducible inhibition of Notch signaling.
(B and C) Single confocal slices of cardiac sections from Tg(kdrl:CreERT2), Tg(hsp70l:mKate2STOPfloxDN-MAML) animals treated during embryogenesis with EtOH (CRTL) (B) or 4-HT (Tg(hsp70l:DN-MAML)EC; abbreviated Tg(DN-MAML)EC) (C), raised to adulthood, heat shocked once, and sacrificed 5 hr later for analysis. Sections were double immunostained for MF20 (magenta) and GFP (green) and counterstained with DAPI (blue). Greater than three sections from more than 5 hearts per group were examined. Little to no variation was observed.
(D) Double-transgenic strain and experimental strategy employed to inhibit Notch signaling specifically in endocardial cells during zebrafish heart regeneration.
(E–J) Cardiac sections from kdrl:CreERT2, hsp70l:mKate2STOPfloxDN-MAML animals treated during embryogenesis with EtOH (CRTL) (E, G, and I) or 4-HT (Tg(hsp70l:DN-MAMLEC); abbreviated Tg(DN-MAML)EC) (F, H, and J), raised to adulthood, subjected to ventricular apex amputation, and heat shocked daily.
(E and F) Single confocal slices of cardiac sections from 30 days post-amputation (dpa) animals immunostained for MF20 (magenta) and counterstained with DAPI (blue). Dashed lines approximate the amputation planes. The asterisk in (F) highlights a gap in the myocardial wall.
(G and H) Cardiac sections from 30 dpa animals stained with AFOG to detect muscle (brown), fibrin (red), and collagen (blue). The asterisk in (H) highlights collagen-rich scar tissue (H). Myocardial regeneration occurred in 10/10 CTRL and 1/16 Tg(DN-MAML)EChearts.
(I and J) Compound microscopic images of cardiac sections from 7 dpa CTRL and Tg(DN-MAML)EC animals double immunostained to detect cardiomyocyte nuclei (α-Mef2 antibody; red) and cycling cells (α-PCNA antibody; green).
(K) Bar graph showing cardiomyocyte proliferation indices on 7 dpa in CTRL (n = 6) and Tg(DM-MAML)EC (n = 5) hearts. Proliferation data were collected for 4–6 sections per heart and averaged to generate each data point. Statistical significance was determined using a Student’s t test. Error bars: ±1 SD. ∗∗p < 0.01. Scale bars: 50 μm.