
|
Fig. S1
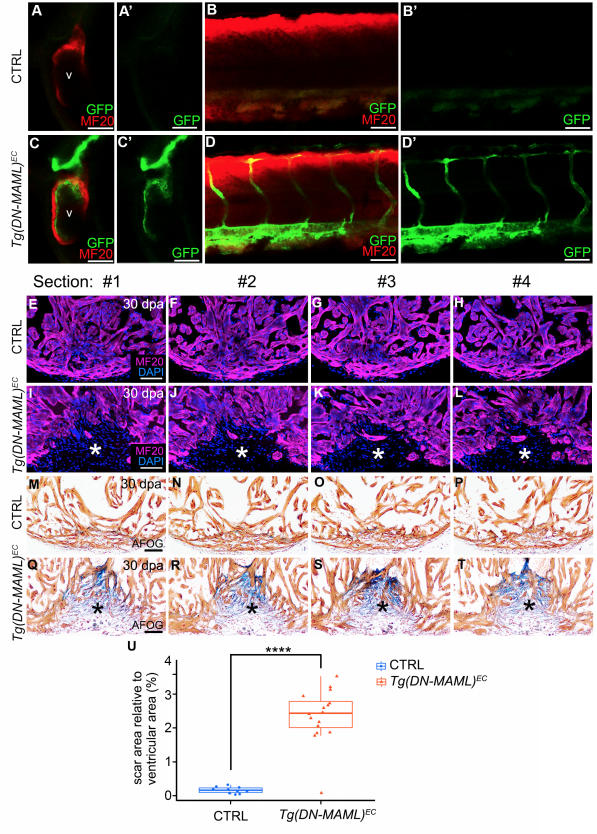
Endocardial Notch signaling is required for zebrafish heart regeneration. Related to Figure 1. (A-D”) Single confocal slices of the hearts (A-A”,C- C”) and tails (B-B”,D-D”) of Tg(kdrl:CreERT2), Tg(hsp70l:mKate2STOPfloxDN-MAML)animals after treatment with EtOH (CTRL; A-B”) or 4-HT [C-D”; Tg(hsp70l:DN-MAML)EC, abbreviated Tg(DN-MAML)EC] between 20 and 40 hours post-fertilization (hpf), heat shocking for 45 minutes at 45 hpf, 5 hours of recovery, and co-immunostaining to detect striated muscle (MF20 antibody; red) and GFP (green). Lateral views, anterior left. n=6 per group. Little to no variation was observed between animals within each experimental group. (E-L) Single confocal slices of histological sections surrounding those shown in Fig. 1E (E-H) and Fig. 1F (I-L) immunostained to detect myocardium (MF20 antibody; magenta) and counterstained with DAPI (blue). The asterisks in (I-L) highlight gaps in the myocardial wall. (M-T) Brightfield images of histological sections surrounding those shown in Fig. 1G (M-P) and Fig. 1H (Q-T) stained with AFOG to detect muscle (brown), fibrin (red), and collagen (blue). The asterisks in (Q-T) highlight collagen-rich scar tissue. (U) Box and whisker plot showing the percentages of total ventricular area occupied by scar tissue in 30 days post amputation CTRL (M-P; n=10) and Tg(DM-MAML)EC (Q-T; n=16) hearts. Scar percentage data were collected for 6-10 sections per heart and averaged to generate each data point. Statistical significance was determined using a Student’s t-test. ****, p<0.0001. Scale bars=50 μm.