- Title
-
Myogenin promotes myocyte fusion to balance fibre number and size
- Authors
- Ganassi, M., Badodi, S., Ortuste Quiroga, H.P., Zammit, P.S., Hinits, Y., Hughes, S.M.
- Source
- Full text @ Nat. Commun.
|
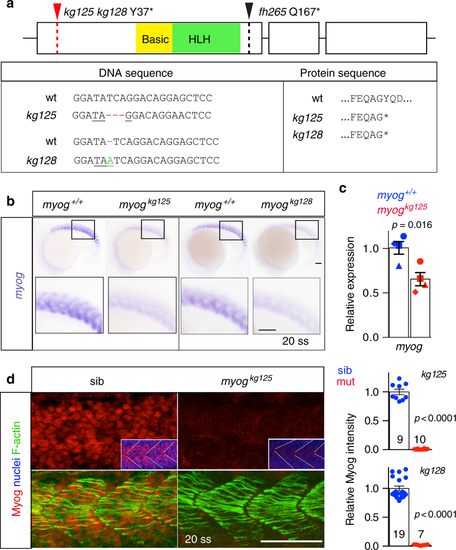
Genome editing generates zebrafish myog null alleles. a Schematic of myog gene exons (boxes) and protein showing the position of kg125, kg128 and fh265 mutant alleles. The tyrosine to stop mutations (Y37*) produce a truncated protein of 36 amino acids (aa) devoid of both basic (yellow) and helix–loop–helix (HLH, green) domains. The fh265 hypomorphic allele (Q167*) truncates downstream of bHLH. Beneath, DNA and protein alignment of wild-type (wt), 3 bp kg125 deletion (red) and 1 bp kg128 insertion (green) alleles with novel stop codons underlined causing an identical truncation. b In situ mRNA hybridisation (ISH) for myogenin on myogkg128/+ and myogkg125/+ incross lays reveal NMD of mutant myog mRNA at 20 somite stage (20 ss). Representative images n = 14 + 5 mutants, n = 39 + 22 sibs, respectively. Insets show magnification of boxed areas. c qPCR analysis on wt sibs and myogkg125 embryos at 22 ss confirms NMD. Mean fold change ± SEM from four independent experiments on genotyped embryos from four separate lays analysed on separate days, paired t test statistic. Symbol shapes denote matched wt and mutant samples from each experiment. d Immunoreactivity of Myog is lost in myogkg125 and myogkg128 mutants at 20 ss, whereas F-actin is unaffected. Insets show nuclear staining in myogkg125 and sib using Hoechst counterstain. Relative myotomal Myog immunofluorescence was assessed by nuclear intensity measurement. All images are lateral views anterior to left, dorsal to top. Representative images n = 10 + 7 mutants, n = 9 + 19 sibs, respectively. Bars = 50 µm EXPRESSION / LABELING:
PHENOTYPE:
|
|
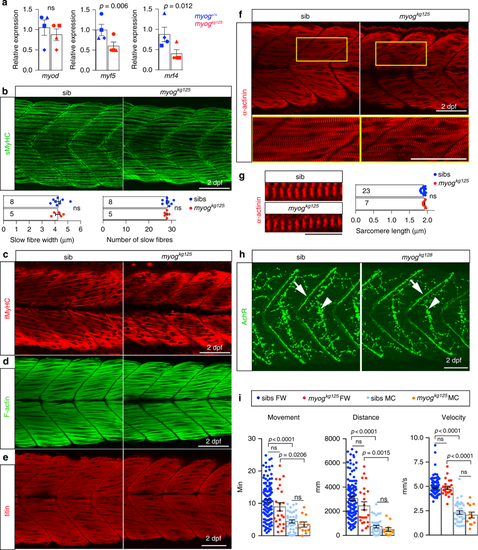
Functional muscle differentiation in Myogenin mutants. a qPCR analysis on wt sibs and myogkg125 embryos at 22 ss showing reduction of myf5, mrf4 but not myod RNAs. Mean fold change ± SEM from four independent experiments on genotyped embryos from four separate lays analysed on separate days, paired t test statistic. Symbol shapes denote matched wt and myog mutant samples from each experiment. b, c Immunodetection of slow and fast myosins (sMyHC and fMyHC) in 2 dpf larvae from a myogkg125/+ incross showing that myofibre differentiation occurs in mutant. Dots in graphs show slow myofibre width (average of six myofibres/larva) and number in somite 17 of sib and mutant individuals. Representative images n = 5 mutants, n = 8 sibs. d–f Phalloidin staining for F-actin or immunolabelling for titin and α-actinin reveals that mutant myofibres display regular sarcomere spacing and are properly assembled to sustain contraction. Representative images n = 5 mutants, n = 21 sibs (phalloidin); n = 7 mutants, n = 18 sibs (titin); n = 7 mutants, n = 23 sibs (α-actinin). In f, boxes are shown magnified below. g Sarcomere length from f (average of 6 myofibres/larva) in sibs and mutants. Numbers of larvae analysed are shown on columns (b, g). h Larvae from a myogkg128/+ incross stained with α-bungarotoxin-Alexa-488 show that mutant embryos accumulate AChR at both neuromuscular junction (arrows) and muscle-muscle junction (arrowheads) comparable to sibs. Representative images n = 4 mutants, n = 11 sibs. i Motor function of 5 dpf larval zebrafish in fish-water (FW; n = 24 mutants, n = 115 sibs) or 0.6% Methyl-Cellulose (MC; n = 12 mutants, n = 36 sibs) as time spent moving (minutes), distance travelled (mm) and average speed (mm/s). Overall muscle function is unaffected by lack of Myog in both FW and MC. Activity of both myog mutants and sibs is affected by MC. Each dot represents the behaviour of an individual larva. ns: not statistically significant in ANOVA. Bars = 50 µm (10 µm in g) EXPRESSION / LABELING:
PHENOTYPE:
|
|
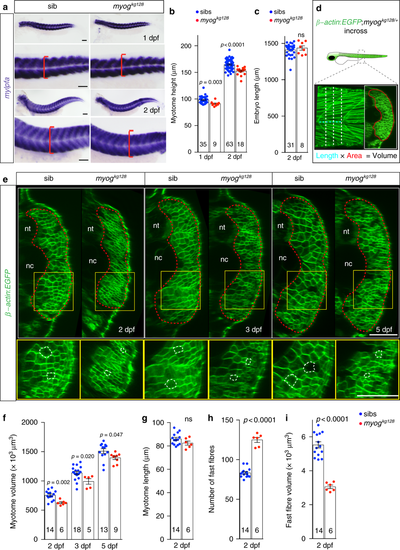
Myogenin is required for normal larval muscle growth. a, b ISH for mylpfa mRNA showing similar level of expression of fast myosin but reduced extent of somitic muscle in mutants (a, red brackets) at 1 and 2 dpf. Myotome height (b) is significantly reduced in myogkg128 mutants at 1 and 2 dpf. Representative images n = 9 + 18 mutants, n = 35 + 63 sibs. c Larval length is unaffected in mutant at 2 dpf, showing that muscle reduction is not due to overall reduced size of mutant larvae. d Schematic of myotome volume measurement. β-actin:EGFP;myogkg128/+ fish were incrossed and progeny imaged by confocal microscopy. Lateral and three equi-spaced transverse images of somite 17 were collected from each larva at each stage (dashed lines). Transverse area (red outline) multiplied by somite length (cyan dashed line) yielded myotome volume for each fish at each stage. e Optical transverse-sections of β-actin:EGFP;myogkg128 mutants show reduced myotome area at 2, 3 and 5 dpf compared to sibs (dashed red lines). Boxes are shown magnified beneath highlighting smaller fibre cross-sections in mutants (dashed white lines). Representative images n = 6 mutants, n = 14 sibs (2 dpf); n = 5 mutants, n = 18 sibs (3 dpf); n = 9 mutants, n = 13 sibs (5 dpf). f Myotome volume reduction in myogkg128 mutants at 2, 3 and 5 dpf. g–i. Myotome length (g), number of fast fibres per cross section (h) and fibre volume (i) at 2 dpf compared by t tests. Bars = 50 μm. nt: neural tube, nc: notochord |
|
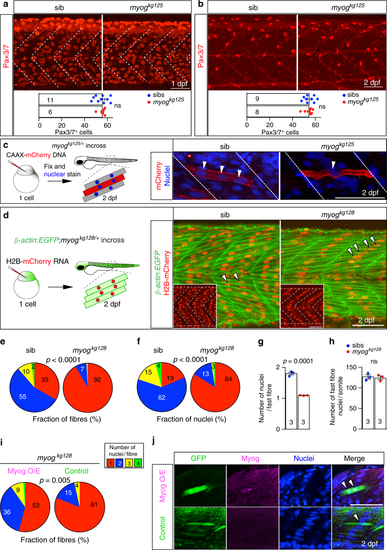
Myogenin promotes fusion of myocytes. a, b Immunodetection and quantification of Pax3/7 positive MPCs in somite 17 of myogkg125/+ incross embryos at 1 dpf and 2 dpf. Mean ± SEM of dots representing individual embryos. Lack of Myog does not alter number of Pax3/7 MPCs per somite (white dashed lines). Representative images n = 6 mutants, n = 11 sibs (1 dpf); n = 8 mutants, n = 9 sibs (2 dpf). c Qualitative analysis of myoblast fusion in a myogkg125/+ incross injected at 1-cell stage with DNA encoding CAAX-membrane targeted mCherry (red). At 2 dpf, larvae were fixed and stained with Hoechst to highlight nuclei (blue) and analysed from 3D stacks. Nuclei within mCherry-labelled fibres (arrowheads) were mostly single in mutants, but multiple in sibs. Representative images n = 6 embryos. d Myoblast fusion quantified by injection of H2B:mCherry RNA into 1-cell stage embryos from β-actin:EGFP;myogkg128/+ incross. Confocal single plane images deep in the myotome of 2 dpf larvae showing muscle fibres and the position of nuclei (insets). Note the central location away from somite borders (dashed white lines) of most nuclei in mutants (arrowheads), similar to that observed in mononucleate superficial slow fibres. Representative images n = 6 embryos. e, f Quantification of fusion within the entire myotome 17, showing the fraction of fast fibres (e) and fraction of nuclei in fast fibres (f) with the indicated number of nuclei. Slow fibre numbers were unaltered. Data report mean values of three larvae per genotype (see Supplementary Fig. 3a for individual data). p-values indicate probability of rejecting null hypothesis of no difference between mutant and sibs in χ2 tests. g Number of nuclei per fast fibre is reduced in mutant. h Total number of nuclei within fast fibres in somite 17 of sib and mutant is unchanged. Dots represent individual embryos. Mean ± SEM. t test. Bars = 50 μm. i, j Mosaic myog:MyogCDS-IRES-GFP plasmid-derived expression of Myog (Myog O/E) rescues fusion in myogkg128 mutant larvae from a myogkg128/+ incross, compared control myog:GFP plasmid (Control). Quantification (as in e) of nuclei in GFP+ cells (i, see Supplementary Fig. 4a for individual data). Immunodetection shows Myog overexpression (Myog O/E, magenta) in myog:MyogCDS-IRES-GFP but not in myog:GFP(Control, green) GFP+ fibres (j). Representative images n = 5 myog:GFP, n = 11 myog:MyogCDS-IRES-GFP injected mutants, ns: not significant |
|
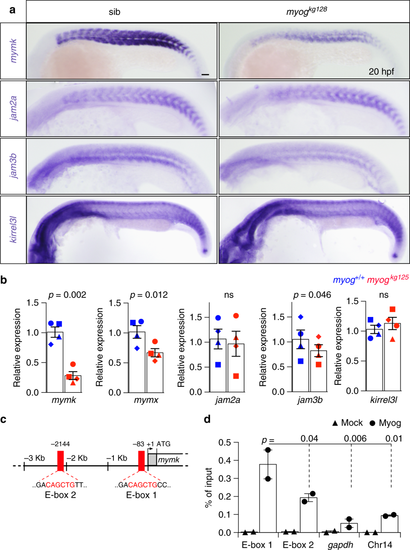
Myogenin mutants have reduced expression of fusogenic factors. a ISH on 20 hpf myogkg128/+ incross to investigate the expression of genes essential for vertebrate myocyte fusion. Expression of myomaker (mymk) and jam3b, but not of jam2a or kirrel3l, is reduced in myog mutant. Bar = 50 μm. Representative images n = 10 mutants, n = 38 sibs (mymk); n = 13 mutants, n = 37 sibs (jam2a); n = 12 mutants, n = 39 sibs (jam3b); n = 7 mutants, n = 13 sibs (kirrel3l). b qPCR analysis of RNA expression levels showing downregulation of mymk, myomixer/myomerger/minion (mymx) and jam3b at 20 hpf on myogkg125 mutants, whereas jam2a and kirrel3l remain unaltered compared to wt (myog+/+) sibs. Graphs show mean fold change ± SEM of four independent experiments; paired t test. Symbol shapes denote wt and mutant samples from paired experiments. c Schematic of 5' genomic region of mymk reporting: 5′-UTR and coding sequence (grey and white boxes), position of E-box elements (red boxes), relative bp distance from 5'UTR start (+1), start codon (arrow, ATG). E-box 1 and E-box 2 sequences are shown in red text. d ChIP-qPCR assay using anti-Myog or mock showing significant Myogenin enrichment on mymk E-box 1 compared to negative controls from the gapdh promoter and a gene-free region on chromosome 14 containing an E-box (Chr14). Mean of percentage of input immunoprecipitated ± SD of two independent experiments, ANOVA EXPRESSION / LABELING:
PHENOTYPE:
|
|
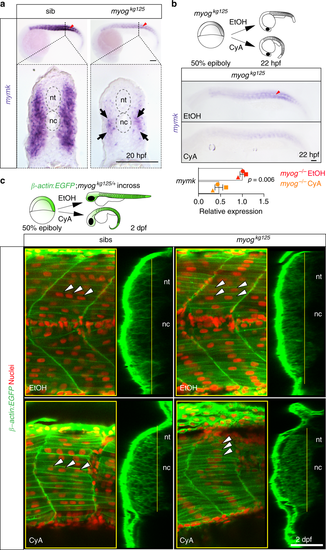
Hedgehog signalling sustains residual fusion and mymk expression. a ISH for myomaker (mymk) at 20 hpf revealed that residual expression in myog mutant is enriched in the medial region of the somite close to notochord (arrows in transverse sections from indicated axial level, dorsal to top). Note lack of expression in mononucleate slow pioneer fibres (arrowheads, upper panel). Representative images n = 6 mutants, n = 14 wt sibs (mymk) b ISH (lateral view, dorsal to top) and qPCR analysis showing that cyclopamine (CyA) treatment of myogkg125 embryos almost abolished mymk mRNA compared to ethanol (EtOH) vehicle control. CyA effectiveness is shown by the absence of unstained slow muscle pioneer cells (arrowhead). Mean fold change ± SEM from three independent experiments on embryos from separate lays of myogkg125 (circles) and myogkg128 (squares and triangles) analysed on separate days, paired t test statistic. Representative images n = 4 EtOH, n = 6 CyA. c Optical confocal sections of the medial region of somites 17 of β-actin:EGFP;myogkg128/+ incross treated with vehicle or CyA. Transverse-section panels show medial position (yellow lines) of respective longitudinal section for each condition. CyA abolished residual fusion in the medial myotome of mutant embryos (arrowheads) but did not detectably affect fusion in sibs. Note that the residual multinucleate fibres in myogkg125 mutant appear larger than adjacent mononucleate fibres in EtOH but are lacking in CyA. nt: neural tube, nc: notochord. Representative images n = 5 mutants, n = 3 sibs (EtOH); n = 4 mutants, n = 6 sibs (CyA). Bars = 50 μm EXPRESSION / LABELING:
PHENOTYPE:
|
|
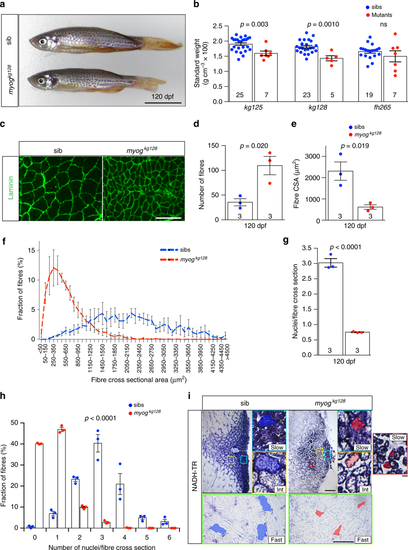
Adult Myogenin mutants have reduced muscle with more but smaller myofibres. a Myog mutant and sib at 120 dpf from myogkg128/+ incross. Bar = 1 cm. Representative images n = 5 mutants, n = 23 sibs. b Myogkg128 or myogkg125 but not myogffh265 showed reduced standard weight compared to co-reared sibs at 120 dpf. Dots represent individuals. c Laminin immunodetection on cryosections from 120 dpf myog128/+ incross. Bar = 100 µm. Representative images, n = 3. d–f Number of muscle fibres in 0.1 mm2 of adult muscle is increased in mutants (d), whereas myofibre cross-sectional area (CSA) is decreased (e) reflecting a shift in CSA frequency distribution compared to sibs. g Fewer myonuclear profiles were present within laminin profiles in adult muscle cross-sections in mutants than in sibs, measured from 107 to 490 fibres at similar medio-lateral and dorso-ventral positions of trunk muscle of three fish per genotype. Mean ± SEM, t test. h Proportions of muscle fibres with indicated number of myonuclei within fibre cross-sectional profile. In sibs, >90% of fibres have more than one nuclear profile, compared with < 15% in mutants. Mean ± SEM, χ2 test. i NADH tetrazolium reductase stain revealed that in both mutants and sibs three fibre types are present: oxidative/slow (slow), intermediate (int) and glycolytic/fast (fast). Size of more glycolytic myofibres (yellow and green insets) is more reduced than oxidative fibres (cyan). Assay was performed on three 120 dpf adult male length-matched fish of each genotype. Representative sib (blue) or mut (red) fibres are highlighted. Mutant presents smaller slow type myofibres ectopically localised in fast domain (red inset). Representative images, n = 3. Bars = 100 μm (except for red, yellow and cyan insets = 10 μm) |
|
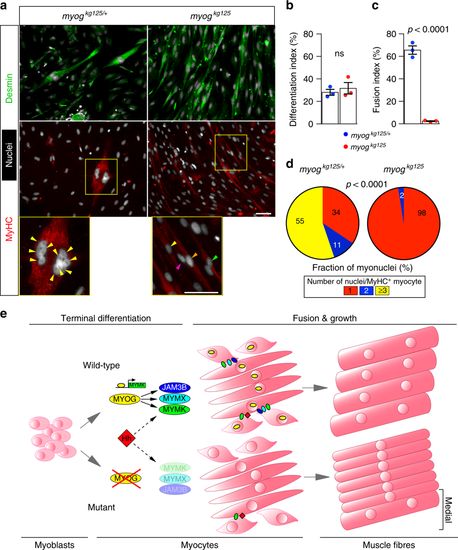
Mutant adult-derived muscle progenitor cells retain fusion deficit ex vivo. a Immunodetection of desmin (green) and MyHC (red) and nuclei (white, Hoechst) in 15 months old myogkg125 and sibling myogkg125/+ adult-derived MPCs following 5 days of differentiation. Fusion into multinucleated myofibres occurred only in sib (magnified boxes), coloured arrowheads indicate nuclei of each cell. Representative images, n = 3. b Extent of differentiation (Differentiation index) is comparable between mutant and heterozygous MPCs. c Fusion index showing deficit in fusion of mutant myocytes. d Number of nuclei in fused MyHC+ cells is reduced in mutant, χ2 test. Three fish per genotype (three technical replicates each). e Schematic of the role of Myogenin during differentiation, fusion and growth of muscle fibres. During myogenesis, committed MPCs leave the cell cycle, begin to elongate and express early muscle-specific genes during terminal differentiation into myocytes. At this stage, Myogenin (MYOG) promotes the expression of myomaker (MYMK), myomixer (MYMX) and jam3b (JAM3B). These fusogenic proteins prompt myocyte fusion to form muscle fibres. In the absence of Myogenin, myocytes undergo terminal differentiation but fail to express Myog-module genes, remain mononucleated and grow less throughout life. Residual myocyte fusion in Myog mutants in the medial region of the somite (bracket) is sustained by Hedgehog (Hh) signalling |
|
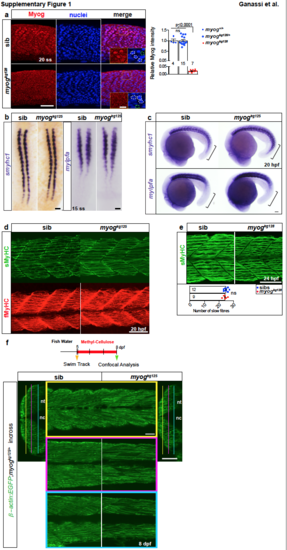
Early myogenesis occurs properly in Myogenin mutant. a. Immunoreactivity of Myog in nuclei is lost in myogkg128 mutants at 20 ss. Insets show magnification of boxed areas; dashed lines denote how nuclei (white) or nucleus-free background area (green) was selected for analysis (see Methods). Graph shows quantification of relative myotomal nuclear Myog immunofluorescence; Myog is significantly reduced in mutants but unchanged in heterozygotes compared to wt sibs (summarized data is shown in Fig. 1d). b. Dorsal view of ISH for smyhc1 and mylpfa mRNAs at 15 ss embryos from a myogkg125/+ incross showing that initial differentiation occurs normally despite absence of Myog. c. ISH for smyhc1 and mylpfa (brackets highlighting difference in expression) at 20 hpf (22 ss) confirming that myogkg125 mutant and sib are indistinguishable. d. Dual immunodetection using S58 (sMyHC) and EB165 (fMyHC) in 20 hpf embryos from a myogkg125/+ incross showing that accumulation of slow and fast myosins occurs normally in mutants. e. Immunodetection using A4.1025 antibody showing no difference in slow fibre number in mutant compared to sib at 1 dpf (24 hpf). Mean ± SEM, t-test. f. Fish from β-actin:EGFP;myogkg125/+ incross were moved from fish water (FW) to 0.6% methyl-cellulose (MC) solution at 5 dpf and left to grow for 72 hours, then confocallyimaged to assess muscle fibre detachment. Sibling and mutant larvae retain attached muscle throughout the myotome. The locations of three different medio-lateral images per larva within somites 16-18 are shown in transverse sections. Remaining images in a, c-f are lateral views anterior to left, dorsal to top. Replicate numbers are given in Supplementary Table 2. Bars = 50 μm, except for a insets (10 μm). |
|
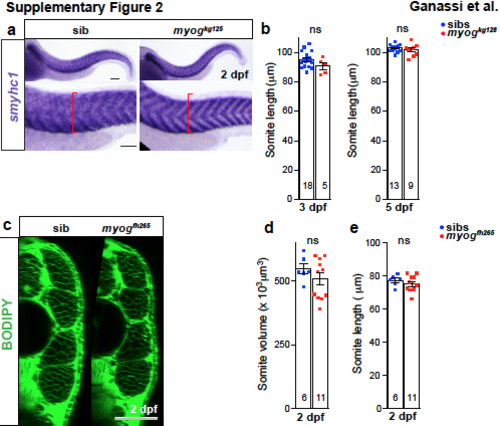
Myogenin mutant has normal smyhc1 expression and myogfh265 has no growth defect. a. ISH shows that at 2 dpf smyhc1 mRNA level is indistinguishable in myogkg125 mutant and sibs, but mutant embryos have a reduced extent of somitic muscle (red brackets). b. Quantification of somite length at 3 and 5 dpf. c. Optical cross sections of myogfh265 mutants and sibs stained with BODIPY. d. Quantitation of somite volume measured in “c”. e. Somite length measurement shows that mutants and sibs are comparable. t-test, ns= not significant. Replicate numbers are given in Supplementary Table 2. Bars = 50 μm. |
|
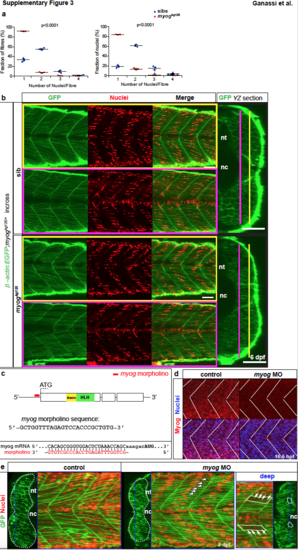
Lack of fusion in myogkg125 and myogkg128 persists until 6 dpf and is phenocopied by Myogenin knockdown. a. Individual quantification of fusion within somite 17 (summarized as pie charts in Fig. 4e-f) showing fraction of fibres with given number of nuclei and fraction of nuclei in fibres with given number of nuclei. Dots represent individual embryos. Mean ± SEM. b. Lack of fusion persists in myog mutants. GFP staining of β-actin:EGFP; myogkg125/+ incross at 6 dpf. Nuclei were stained with Hoechst (red). Transverse sections (YZ) report position of parasaggital sections (pink and yellow lines). c. Schematic of myog mRNA showing the position and nucleotide sequence of morpholino (red bold line), which anneals close upstream of ATG start codon. d. To knock down Myog, morpholino (MO) was injected at 1-cell stage into β-actin:EGFP embryos. Myog immunodetection and Hoechst stained nuclei (blue) at 16.5 hpf showed loss of nuclear Myog immunoreactivity in MO embryos. White lines indicate somite borders. e. At 2 dpf, MO and control injected embryos were fixed and incubated with Hoechst to highlight nuclei (red) prior to confocal imaging. As in myog mutants, knockdown of Myog led to overabundance of smaller mononucleated muscle fibres and reduced the size of the myotome. Multinucleated fibres remained in deep regions (‘deep’, right panel) of the myotome. White dashed lines outline somite cross-section, white plain lines outline multinucleated fibres, arrows indicate nuclei within a fibre and blue line indicates the position of the cross sections. nt; neural tube, nc; notochord. Replicate numbers are given in Supplementary Table 2. Bars = 50 μm. |
|
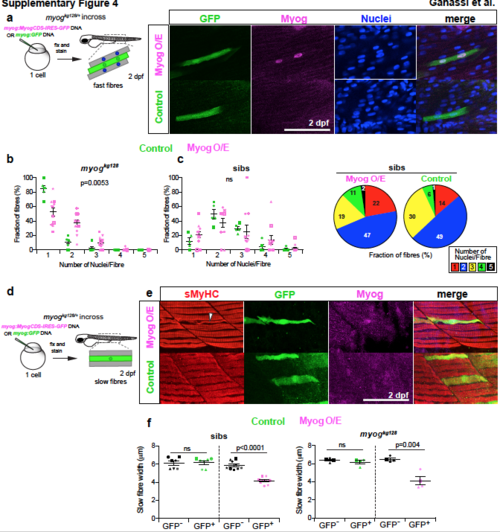
Myog overexpression rescues fast myogenesis in myog mutants but does not promote fusion by slow fibres. a. Quantitative analysis of fusion rescue in a myogkg128/+ incross injected at 1-cell stage with DNA encoding myog:MyogCDS-IRES-GFP (Myog O/E) or myog:GFP (Control) plasmids. Myog and GFP immunodetection and Hoechst stained nuclei (blue) at 2 dpf showed accumulation of Myog in Myog O/E GFP+ fibres but not in control GFP+ fibres in sibling embryos. b,c. Individual quantification of fraction of GFP+ fast fibres with the indicated number of nuclei in mutant (b) or sibling (c) embryos from same incross (mutant data also summarized as pie charts in Fig. 4i). Mosaic Myog expression rescues mutant phenotype but does not increase fusion frequency in sibs. Symbol shape represents individual embryos. Mean ± SEM, χ2 test. d. Schematic of analysis (e,f) of myog:MyogCDS-IRES-GFP (Myog O/E) or myog:GFP (Control) mosaic expression in slow fibres in a myogkg128/+ incross. e. Slow MyHC (sMyHC, F59), GFP and Myog immunodetection at 2 dpf in a sibling showing accumulation of Myog in a Myog O/E GFP+ slow fibre but not in a control GFP+ slow fibre. Myog O/E in slow fibres fails to induce fusion but leads to thin fibres with mis-positioned myofibrils (arrowhead). f. Quantification of fibre width in mutant (myogkg128) or sibling (sibs) embryos mosaically expressing myog:MyogCDS-IRES-GFP (Myog O/E, magenta) or myog:GFP (Control, green). Symbols represent fibre width of GFP+ (magenta or green symbols) or neighbouring GFP- (black symbols) slow fibres within individual embryos, compared by paired t-test statistic. Replicate numbers are given in Supplementary Table 2. |
|
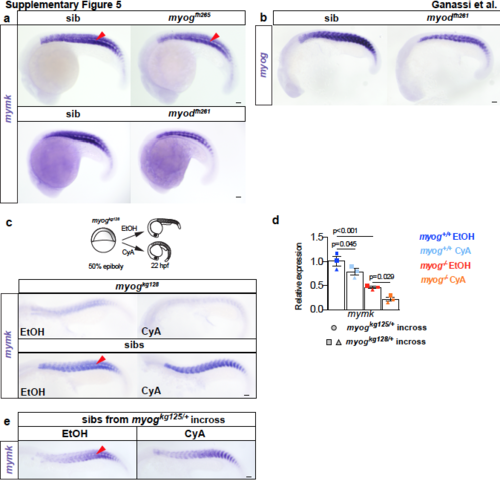
Myogfh265 and myodfh261 mutation and cyclopamine treatment have little effect on myomaker expression. ISH for mymk (a,c,e) and myog (b) mRNAs. a. Expression of mymk mRNA is little affected in myogfh265 and myodfh261 mutants at 20 hpf. Note lack of expression in mononucleate slow pioneer fibres (arrowheads). b. ISH for myog showing that mRNA level is reduced in proportion to the loss of fast muscle in myodfh261 mutant at 20 hpf. c. Schematic of CyA (or EtOH vehicle) treatment of embryos from myogkg128/+ incross. Residual mymk mRNA in 22 hpf myogkg128 mutants is downregulated by CyAtreatment. CyA effectiveness is shown by the loss of unstained slow muscle pioneer cells (arrowheads). d. qPCR analysis showing the effect of CyA treatment on both mutant alleles. CyA also significantly reduced mymk expression in myog+/+ embryos. Mean fold change ± SEM from three independent experiments on pooled genotyped embryos from separate lays of myogkg125 (circles) and myogkg128 (squares and triangles) analysed on separate days, ANOVA statistic. e. ISH for mymk on myogkg125 siblings (related to Fig. 6b). Replicate numbers are given in Supplementary Table 2. Bars = 50 μm. |
|
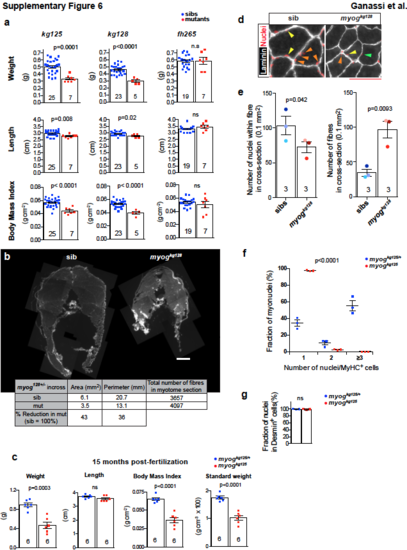
Weight and Body mass index are reduced in myog mutants. a. Weight, length and body mass index of 120 dpf adults derived from myogkg128/+, myogkg125/+ and myogfh265/+ incrosses. Lays were reared as mixed genotypes through nursery at a density of at 50 larvae/3 L tank, decreasing to 17 fish/tank from fingerling stage. Size divergence in sibs did not correlate with genotype (+/+ or +/-), and likely reflects genetic background and feeding rate variation. b. Reconstruction of entire adult 120 dpf muscle trunk sections. Table shows total muscle area and perimeter are reduced by 43% and 36% in myogkg128 mutant adult fish compared to matched sib (sib), whereas fibre number is similar. Bar = 500 μm. c. Weight, length, body mass index and standard weight of 15 mpf (months post fertilization) adults derived from myogkg125/+ incross revealed persistent muscle growth defect in mutants. d. Representative images of transverse sections from myogkg128 mutant and sib. Laminin staining (white) and Hoechst (red) were used to highlight fibres and nuclei. Coloured arrowheads indicate nuclei within single fibres. Bar = 50 μm. e. Three fish of each genotype were cryosectioned and nuclei/fibre were scored as nuclear profiles within laminin rings. Total number of nuclei within fibres in each 0.1 mm2 section is mildly reduced, but number of fibres is increased in mutants compared to sibs. Dot colours identify individuals to allow direct comparison between the two analyses. Mean ± SEM, t-tests. ns= not significant. f. Analysis of adult-derived MPCs from 15 month old myogkg125 and sibling myogkg125/+ following 5 days of differentiation. Proportion of nuclei in MyHC+ cells showing fraction of nuclei in cells with given number of nuclei. Same data is shown as pie charts in Fig. 8d. Dots represent data from individual fish. Three fish per genotype (three technical replicate each). Mean ± SEM. g. Frequency of Desmin+ cells in mutant is comparable to sib. Three fish per genotype (three technical replicate each). Replicate numbers are given in Supplementary Table 2. Bar = 50 μm (insets = 10 μm). |

