
|
Fig. 4
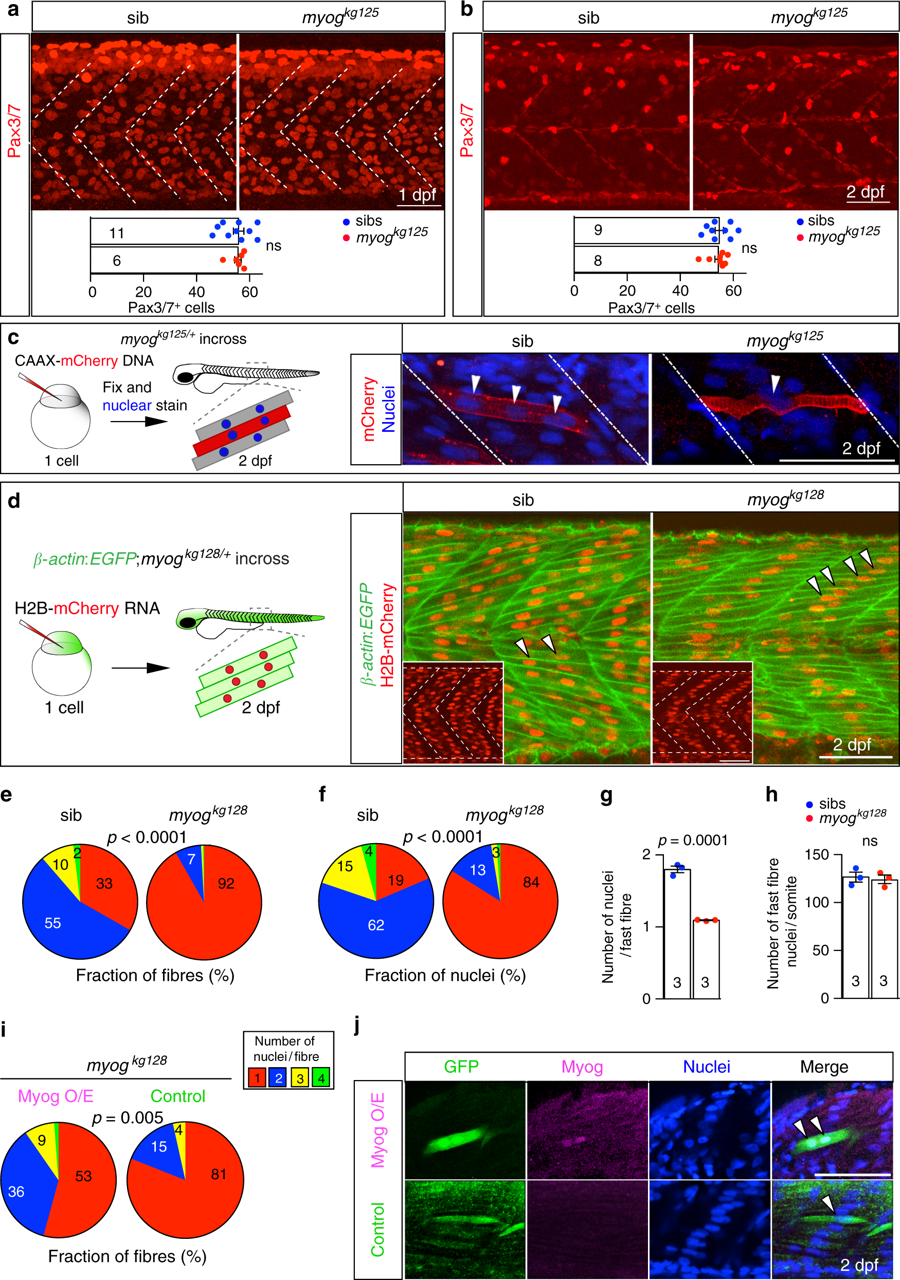
Myogenin promotes fusion of myocytes. a, b Immunodetection and quantification of Pax3/7 positive MPCs in somite 17 of myogkg125/+ incross embryos at 1 dpf and 2 dpf. Mean ± SEM of dots representing individual embryos. Lack of Myog does not alter number of Pax3/7 MPCs per somite (white dashed lines). Representative images n = 6 mutants, n = 11 sibs (1 dpf); n = 8 mutants, n = 9 sibs (2 dpf). c Qualitative analysis of myoblast fusion in a myogkg125/+ incross injected at 1-cell stage with DNA encoding CAAX-membrane targeted mCherry (red). At 2 dpf, larvae were fixed and stained with Hoechst to highlight nuclei (blue) and analysed from 3D stacks. Nuclei within mCherry-labelled fibres (arrowheads) were mostly single in mutants, but multiple in sibs. Representative images n = 6 embryos. d Myoblast fusion quantified by injection of H2B:mCherry RNA into 1-cell stage embryos from β-actin:EGFP;myogkg128/+ incross. Confocal single plane images deep in the myotome of 2 dpf larvae showing muscle fibres and the position of nuclei (insets). Note the central location away from somite borders (dashed white lines) of most nuclei in mutants (arrowheads), similar to that observed in mononucleate superficial slow fibres. Representative images n = 6 embryos. e, f Quantification of fusion within the entire myotome 17, showing the fraction of fast fibres (e) and fraction of nuclei in fast fibres (f) with the indicated number of nuclei. Slow fibre numbers were unaltered. Data report mean values of three larvae per genotype (see Supplementary Fig. 3a for individual data). p-values indicate probability of rejecting null hypothesis of no difference between mutant and sibs in χ2 tests. g Number of nuclei per fast fibre is reduced in mutant. h Total number of nuclei within fast fibres in somite 17 of sib and mutant is unchanged. Dots represent individual embryos. Mean ± SEM. t test. Bars = 50 μm. i, j Mosaic myog:MyogCDS-IRES-GFP plasmid-derived expression of Myog (Myog O/E) rescues fusion in myogkg128 mutant larvae from a myogkg128/+ incross, compared control myog:GFP plasmid (Control). Quantification (as in e) of nuclei in GFP+ cells (i, see Supplementary Fig. 4a for individual data). Immunodetection shows Myog overexpression (Myog O/E, magenta) in myog:MyogCDS-IRES-GFP but not in myog:GFP(Control, green) GFP+ fibres (j). Representative images n = 5 myog:GFP, n = 11 myog:MyogCDS-IRES-GFP injected mutants, ns: not significant