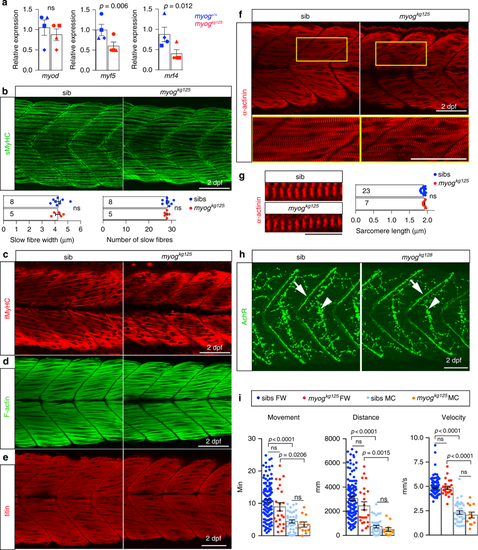
Functional muscle differentiation in Myogenin mutants. a qPCR analysis on wt sibs and myogkg125 embryos at 22 ss showing reduction of myf5, mrf4 but not myod RNAs. Mean fold change ± SEM from four independent experiments on genotyped embryos from four separate lays analysed on separate days, paired t test statistic. Symbol shapes denote matched wt and myog mutant samples from each experiment. b, c Immunodetection of slow and fast myosins (sMyHC and fMyHC) in 2 dpf larvae from a myogkg125/+ incross showing that myofibre differentiation occurs in mutant. Dots in graphs show slow myofibre width (average of six myofibres/larva) and number in somite 17 of sib and mutant individuals. Representative images n = 5 mutants, n = 8 sibs. d–f Phalloidin staining for F-actin or immunolabelling for titin and α-actinin reveals that mutant myofibres display regular sarcomere spacing and are properly assembled to sustain contraction. Representative images n = 5 mutants, n = 21 sibs (phalloidin); n = 7 mutants, n = 18 sibs (titin); n = 7 mutants, n = 23 sibs (α-actinin). In f, boxes are shown magnified below. g Sarcomere length from f (average of 6 myofibres/larva) in sibs and mutants. Numbers of larvae analysed are shown on columns (b, g). h Larvae from a myogkg128/+ incross stained with α-bungarotoxin-Alexa-488 show that mutant embryos accumulate AChR at both neuromuscular junction (arrows) and muscle-muscle junction (arrowheads) comparable to sibs. Representative images n = 4 mutants, n = 11 sibs. i Motor function of 5 dpf larval zebrafish in fish-water (FW; n = 24 mutants, n = 115 sibs) or 0.6% Methyl-Cellulose (MC; n = 12 mutants, n = 36 sibs) as time spent moving (minutes), distance travelled (mm) and average speed (mm/s). Overall muscle function is unaffected by lack of Myog in both FW and MC. Activity of both myog mutants and sibs is affected by MC. Each dot represents the behaviour of an individual larva. ns: not statistically significant in ANOVA. Bars = 50 µm (10 µm in g)
|
