
- Title
-
Myosin1D is an evolutionarily conserved regulator of animal left-right asymmetry
- Authors
- Juan, T., Géminard, C., Coutelis, J.B., Cerezo, D., Polès, S., Noselli, S., Fürthauer, M.
- Source
- Full text @ Nat. Commun.
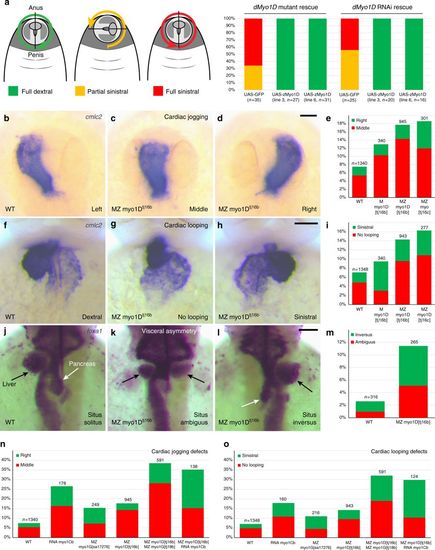
myo1D controls zebrafish left–right asymmetry. a Transgene-mediated expression of zebrafish myo1D (zmyo1D) restores the laterality of genitalia rotation in Drosophila myo1D (dmyo1D) mutant or dmyo1D RNAi flies. Lines 3 and 6 are two independent transgenic insertions. b–e Zebrafish MZ myo1D mutants present defects in leftward cardiac jogging. b–d Dorsal views of the cmlc2-expressing heart primordium at 26 hpf, anterior up. e Quantification of cardiac jogging defects in maternal (M) and maternal zygotic (MZ) myo1Dtj16b or myo1Dtj16c mutants. f–i Cardiac looping is affected in MZ myo1D mutants. f–h Frontal views of the cmlc2-expressing heart at 48 hpf, dorsal up. i Quantification of cardiac looping defects in M myo1Dtj16b and MZ myo1Dtj16b or MZ myo1Dtj16c mutants. j–m MZ myo1D mutants present defects in the leftward looping of the gut and the asymmetric development of the liver (black arrows) and pancreas (white arrows). j–l Dorsal views of foxa1-expressing visceral organs at 48 hpf, anterior up. n, o Overexpression of zebrafish myo1Cb RNA impairs cardiac jogging (n) and looping (o). MZ myo1G single mutants present laterality defects (n, o). MZ myo1D; MZ myo1G double mutants or MZ myo1D mutants injected with myo1Cb RNA present an increased frequency of defects compared to MZ myo1D mutants (n, o). Scale bars: 30 µm |
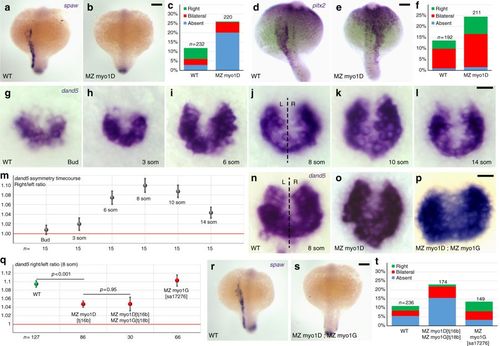
myo1D is required for left–right Organizer function. a–f MZ myo1D mutants display an impaired expression of southpaw (spaw) and pitx2 in the left lateral plate mesoderm. c, f Quantifications of spaw (c) and pitx2 (f) expression. For pitx2, the most marked difference between WT and MZ myo1D mutants is observed in the category with right-sided expression (e). g–m Temporal evolution of the asymmetry of dand5 expression between the end of gastrulation (Bud) and the 14-somite stage. m Quantifications of the relative abundance of dand5 transcripts on the left (L) and right (R) side of WT ABTÜ embryos reveal a peak of LR asymmetry at the eight-somite stage. n–q Eight-somite stage asymmetry of dand5 asymmetry is reduced in MZ myo1D mutants. No further reduction of asymmetry is observed in MZ myo1D; MZ myo1G double mutants. For values of dand5 asymmetry for individual display items, see Methods. r–t Asymmetric spaw expression is altered in MZ myo1D; MZ myo1G double mutants. The frequency of defects is comparable to MZ myo1D single mutants (c). a, b, d, e, r, s are dorsal views of 18-somite stage embryos, anterior up. g–l and n–p are dorsal views of the LRO, anterior up. Error bars in m and q indicate SEM. Scale bars: 50 µm in a, b, d, e, r, s; 20 µm in g–l and n–p EXPRESSION / LABELING:
PHENOTYPE:
|
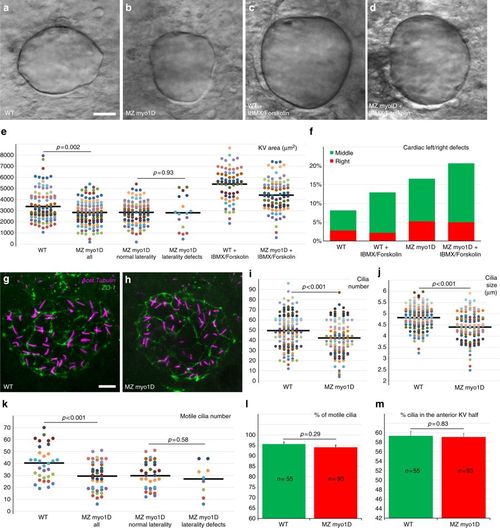
myo1D controls the morphogenesis of the zebrafish left–right Organizer. a–e Compared to WT (n = 104), MZ myo1D mutants (n = 118) present a reduced KV size. Treatment with IBMX and Forskolin promotes KV lumen inflation and increases organ size in WT (n = 66) and MZ myo1D mutants (n = 85). e Dot plots of KV equatorial surface area in individual embryos. KV size is similar in embryos with normal or defective laterality. f IBMX/Forskolin treatment restores KV size (d, e), but not laterality in MZ myo1D mutants. g–j Cilia number and size are reduced in MZ myo1D mutants. g, h Projection of images from confocal stacks used to quantify number and length of cilia (acetylated tubulin, magenta) in the KV (ZO-1 positive cells, green). i, j Number and average length of cilia in individual embryos are reduced in MZ myo1D (n = 117 embryos/4939 cilia) compared to WT (n = 141/6967). k–m Confocal imaging of Arl13b-GFP labeled cilia in living embryos was used to analyze the number (k), motility (l) and positioning (m) of KV cilia. k Dot plot representing motile cilia number in individual embryos. MZ myo1D (n = 42) mutants display lower motile cilia numbers compared to WT (n = 33). Motile cilia numbers are however similar in MZ myo1D mutant embryos with normal or defective laterality. Total cilia numbers for this experiment are displayed in Supplementary Fig. 5. l myo1D loss of function does not impair ciliary motility. m WT and MZ myo1D mutant animals display a similar enrichment of cilia in the anterior KV half. a–d, g, h are dorsal views of the KV, anterior up. All data collected at the eight-somites stage. Horizontal bars in e, i, j, k represent mean values. Error bars in l, m represent SEM. Scale bars: 20 µm in a–d; 10 µm in g–h PHENOTYPE:
|
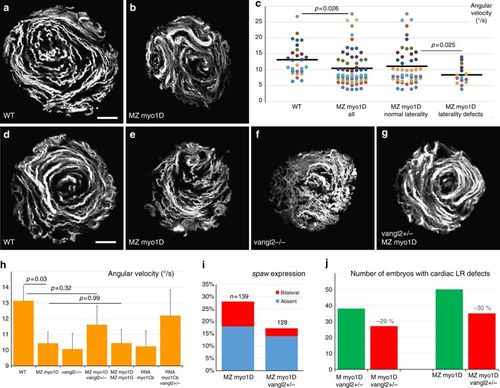
myo1D is required for the establishment of zebrafish left–right organizer flow. a–c KV flow is altered in MZ myo1D mutants. Temporal projections of the trajectories of fluorescent microspheres in WT (a, n = 28) and MZ myo1D mutants (b, n = 63). c MZ myo1D embryos display lower mean angular KV flow velocities than WT. MZ myo1D mutants with defective cardiac jogging show lower velocities than their sibling with normal laterality. d–g MZ myo1D (e) and vangl2 (f, n = 36) mutants present an altered LRO flow compared to WT (d) but flow pattern is restored in MZ myo1D ; vangl2+/− (g, n = 25). h MZ myo1D mutants display a reduced KV flow velocity compared to WT, as do vangl2−/− embryos (p = 0.03). Flow in MZ myo1D ; vangl2+/− is however similar to WT. Flow velocity in MZ myo1D; MZ myo1G double mutants is reduced compared to WT (n = 29, p = 0.04) but similar to MZ myo1D single mutants. Flow velocity in WT embryos injected with myo1Cb RNA is reduced compared to WT controls (n = 37, p = 0.04). Removal of one copy of vangl2 makes flow velocity again similar to WT (n = 19, p = 0.62). i, j The removal of one copy of vangl2 reduces defects in asymmetric spaw expression (i) and cardiac morphogenesis (j) in MZ myo1D (see Methods). a, b, d–g are dorsal views of eight-somites stage KVs, anterior up. Display items and quantifications in a–h are derived from the same dataset. Horizontal bars in c represent mean values. Error bars in h indicate SEM. Scale bars: 20 µm in a, b, d–g |
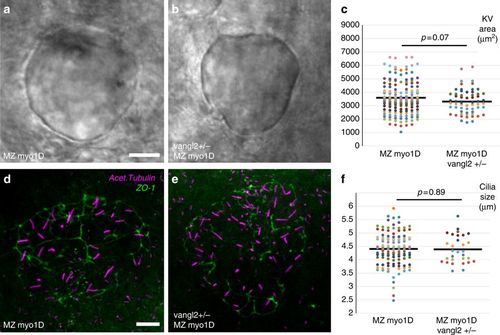
KV area and cilia size are similar in MZ myo1D and MZ myo1D vangl2+/−. a–c MZ myo1D (n = 156) and MZ myo1D ; vangl2+/− (n = 60) animals have similar KV sizes. d–e Projection of images from confocal stacks used to quantify the length of cilia (acetylated tubulin, magenta) in the KV (ZO-1 positive cells, green) of MZ myo1D mutants (d), or MZ myo1D ; vangl2+/− embryos (e). f MZ myo1D (n = 117 embryos/4939 cilia) and MZ myo1D ; vangl2+/− (n = 30/1653) embryos present a similar cilia size. The MZ myo1D mutant dataset displayed in f is the same that is also displayed in Fig. 3j. a, b, d, e are dorsal views of eight-somites stage KVs, anterior up. Scale bars: 20 µm in a, b; 10 µm in d, e PHENOTYPE:
|
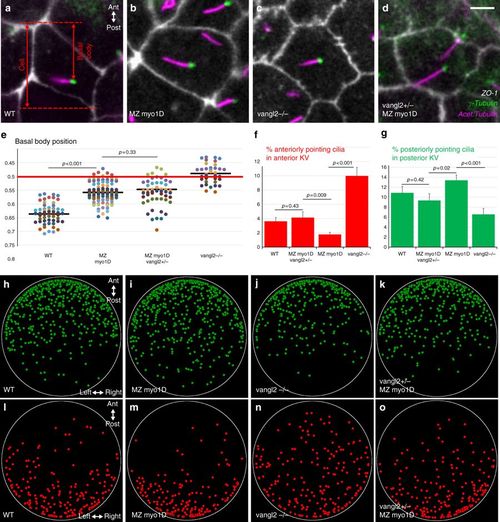
myo1D interacts with vangl2 to control cilia orientation in the zebrafish left–right Organizer. a–e myo1D and vangl2 are required for basal body positioning. a–d High magnification views of KV cells (ZO-1) with cilia (acetylated tubulin) and basal bodies (γ-tubulin). e Dot plot representing average antero-posterior basal body position in individual embryos (see Methods). Compared to WT (a, n = 40 embryos/744 basal bodies), basal bodies are displaced anteriorly in MZ myo1D (b, n = 74/1521) or vangl2 (c, n = 36/526) mutants. Basal bodies are similarly affected in MZ myo1D and MZ myo1D ; vangl2+/− (d, n = 37/826). f, g MZ myo1D (n = 93 embryos/3172 cilia) and vangl2 (n = 50/1545) mutations have opposing effects on cilia orientation. Cilia orientation in MZ myo1D ; vangl2+/− (n = 35/1225) is similar to WT (n = 55/2275). h–o two-dimensional dot plots indicating the position of KV cilia pointing to the anterior (red) or posterior (green) in the KV of embryos of different genotypes. Posteriorly pointing cilia invade the posterior KV in MZ myo1D (i), while anterior pointing cilia invaded the anterior KV in vangl2−/− (n). In MZ myo1D ; vangl2+/− (k, o), cilia distribution is again more similar to WT (see Supplementary Fig. 9 for details). All data collected at eight-somites stage, anterior up in a–d, h–o. Horizontal bars in e represent mean values. Error bars in f, g indicate SEM. Scale bar: 5 µm in a–d PHENOTYPE:
|
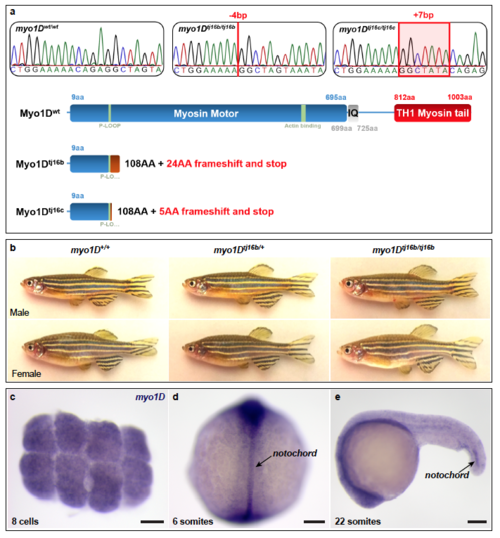
Genetic inactivation of zebrafish myo1D a, Sequence chromatograms and schematic representation of myo1D mutants generated by Crispr/Cas9 mutagenesis. b, myo1D homozygous mutant adult fish are indistinguishable from heterozygous or homozygous wild-type siblings. c, Whole-mount in situ hybridization reveals that myo1D transcripts are maternally supplied and can be detected at the 8-cell stage (animal pole view), well before the activation of the zygotic genome. d, e, Zygotic myo1D transcripts are present at low levels throughout the embryo. At segmentation stages, increased transcript levels are detected in the notochord. d, dorsal view, anterior up. e, lateral view, anterior to the left. Scale bars: 100 μm. EXPRESSION / LABELING:
PHENOTYPE:
|
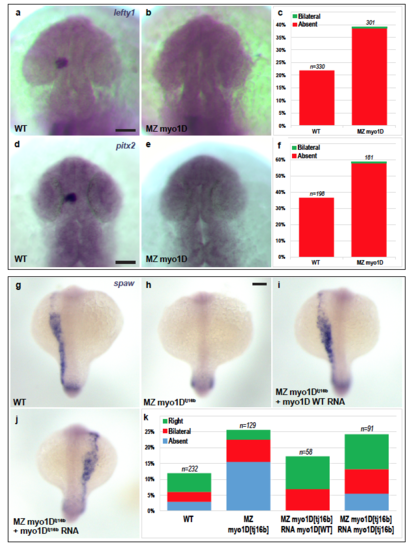
Zebrafish myo1D controls Left-Right asymmetry in the brain, heart and viscera a-f, Asymmetric expression of lefty1 and pitx2 is impaired in the brain of MZ myo1D mutant animals. Dorsal views of lefty1 (22-somite stage) and pitx2 (25-somite stage) expression in WT (a,d) and MZ myo1D mutant (b,e) embryos. Quantification of lefty1 (c) and pitx2 (f) expression shows that asymmetric gene expression often fails to be established in mutants. g-k, MZ myo1D mutants display defects in the asymmetric expression of the nodal-related gene southpaw (spaw) in the left lateral plate mesoderm (h,k). These defects can be partially rescued by injecting wild-type myo1D RNA (i,k), but not by myo1Dtj16b mutant RNA (j,k). For the purpose of comparison, we also show the level of spaw asymmetry in wild-type embryos, using the dataset also presented in Fig. 2a-c. Scale bars: 30 μm in a,b,d,e. 50 μm in g-j. PHENOTYPE:
|
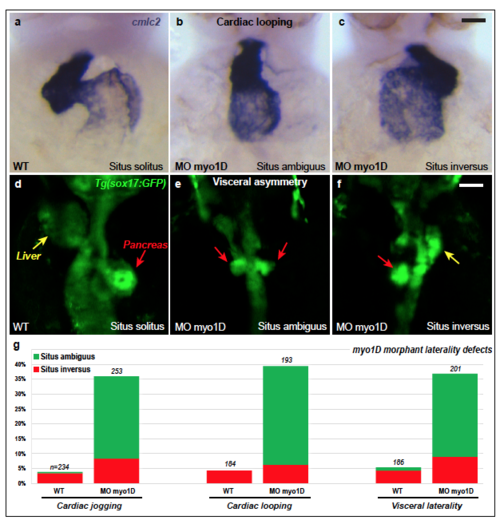
myo1D morpohlino knock-down elicits Left-Right asymmetry defects a-g, Morpholino knock-down of myo1D elicits laterality defects at the level of the heart and viscera. myo1D morphants present defects in cardiac jogging (g) and looping (a-c, g). a-c are frontal views of the cmlc2-expressing heart at 48 hpf, dorsal up. d-f, myo1D knock-down impairs the leftward looping of the gut as well as the lateralized development of the liver (yellow arrows) and pancreas (red arrows). Dorsal views of visceral organs highlighted by an endodermal sox17:GFP transgene. Anterior is up. Scale bars: 20 μm in a-c. 50 μm in d-f. |
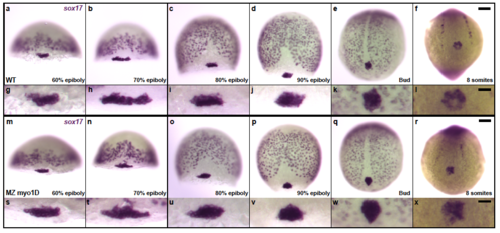
Zebrafish myo1D is not required for the specification and migration of Left-Right organizer precursor cells a-x, sox17 in situ hybridization marks scattered endodermal cells as well as the posterior cluster of dorsal forerunner cells that give rise to the fish Left/Right Organizer, Kupffer’s Vesivle (KV). Comparison of WT (a-l) and MZ myo1D mutant (m-x) embryos reveals no differences in the number and behavior of KV precursor cells. a-d,m-p, are dorsal views, anterior up. e,f,q,r, are vegetal views of the tail bud region at the end of gastrulation (e,q) and the 8-somite stage (f,r). Anterior is up. a-f,m-r represent low magnification views of the whole embryo. g-l,s-x show high magnification views of the KV precursor cells. Scale bars: 50 μm in a-f,m-r . 20 μm in g-l,s-x. |
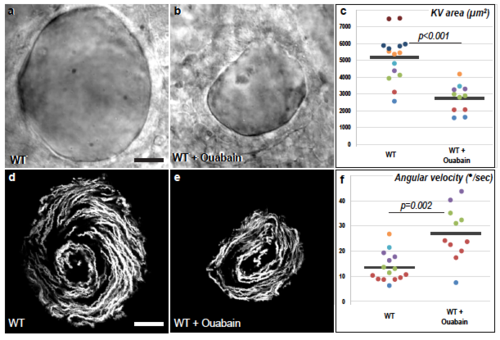
The velocity of the zebrafish Left-Right Organizer flow increases upon pharmacological reduction of organ size. a-c, Ouabain treatment of WT embryos inhibits lumen inflation of Kupffer’s Vesicle (KV) and thereby reduces organ size. a,b, are brightfield images of the equatorial plane of control (a, n=15) and Ouabain-treated embryos (b, n=11). d-f, Both WT control (d) and Ouabain-treated embryos (e) display a circular flow pattern. d,e are temporal projections of the trajectories of fluorescent microspheres in the KV lumen of the embryos displayed in a and b. f, The angular velocity of the KV flow is increased upon Ouabain treatment. a,b,d,e are dorsal views of 8 somites stage KVs, anterior is up. Horizontal grey bars in c,f represent mean values. The WT control embryos displayed in this figure are also part of the dataset that is used in Fig. 4a-h. Scale bars: 20 μm. |

ZFIN is incorporating published figure images and captions as part of an ongoing project. Figures from some publications have not yet been curated, or are not available for display because of copyright restrictions. PHENOTYPE:
|
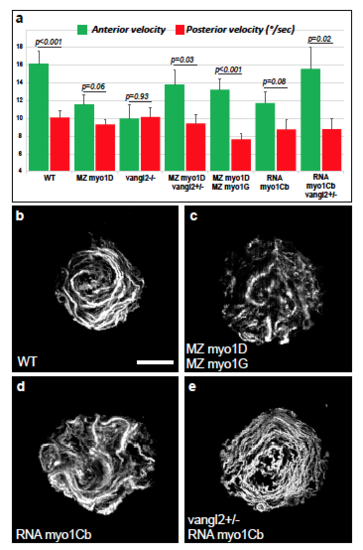
myosin1 and vangl2 genes control Left-Right Organizer flow a, WT embryos display a higher flow velocity in the anterior compared to the posterior KV (n=28). This antero-posterior asymmetry is reduced in MZ myo1D (n=63) and vangl2 (n=36) mutants, but restored in MZ myo1D ; vangl2+/- (n=25). MZ myo1D ; MZ myo1G double mutants (n=29) maintain a higher flow speed in the anterior KV, suggesting that their LR asymmetry defects are mainly due to the observed overall reduction in KV flow velocity and circularity (Fig.4h and c below). The antero-posterior velocity gradient is diminished in WT embryos injected with myo1Cb RNA (n=37), but restored again upon removal of one copy of vangl2 (n=19). b-e, Temporal projections of trajectories of fluorescent microspheres in the KV lumen. Compared to WT, MZ myo1D ; MZ myo1G double mutants or WT embryos injected with myo1Cb RNA display altered KV flows. Flow pattern is partially restored when myo1Cb RNA is injected in embryos heterozygous for vangl2. Dorsal views of 8 somites stage KVs, anterior up. Quantifi-cations and display items are from the same dataset that is also used in Fig. 4a-h. Scale bar: 20 μm. |
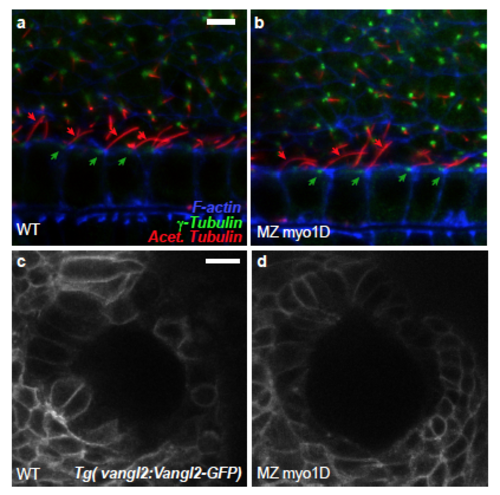
Myo1D is not required for floor plate cilia orientation and Vangl2 localisation a,b, In the floor plate of 22 somite stage WT controls (a), 85.3% of the analyzed basal bodies (n=116) are posteriorly localized (green arrows) and 90.6% of the cilia posteriorly tilted (n=117, red arrows). Similarly, 80.5% of the basal bodies (n=164) and 96.8% of the cilia (n=157) are oriented towards the posterior in MZ myo1D mutants (b). Data were obtained from 18 WT and 22 MZ myo1D mutant embryos. Lateral views of the floor plate, anterior to the left. c,d, In the Left-Right organizer of both WT (n=15) and MZ myo1D mutant (n=20) embryos, Vangl2-GFP displays a similar localisation at the cell cortex. Dorsal views of 8 somites stage KVs, anterior up. Scale bars: 5 μm in a,b. 15 μm in c,d. |
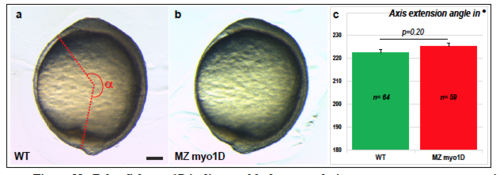
Zebrafish myo1D is dispensable for gastrulation stage convergence-extension a-c, myo1D is not required for the PCP-dependent convergence-extension movements that drive antero-posterior axial elongation in gastrulation stage zebrafish embryos. Lateral views of bud stage WT (a) and MZ myo1D mutant (b) embryos, anterior up. Axial extension was quantified by measuring the angle between the anterior extremity of the hatching gland and the posterior extremity of the tail bud, as indicated schematically in a. c, A quantification of bud stage axial extension reveals no significant difference between WT and MZ myo1D mutant embryos. Error bars in c indicate SEM. Scale bar: 100 μm. |