
|
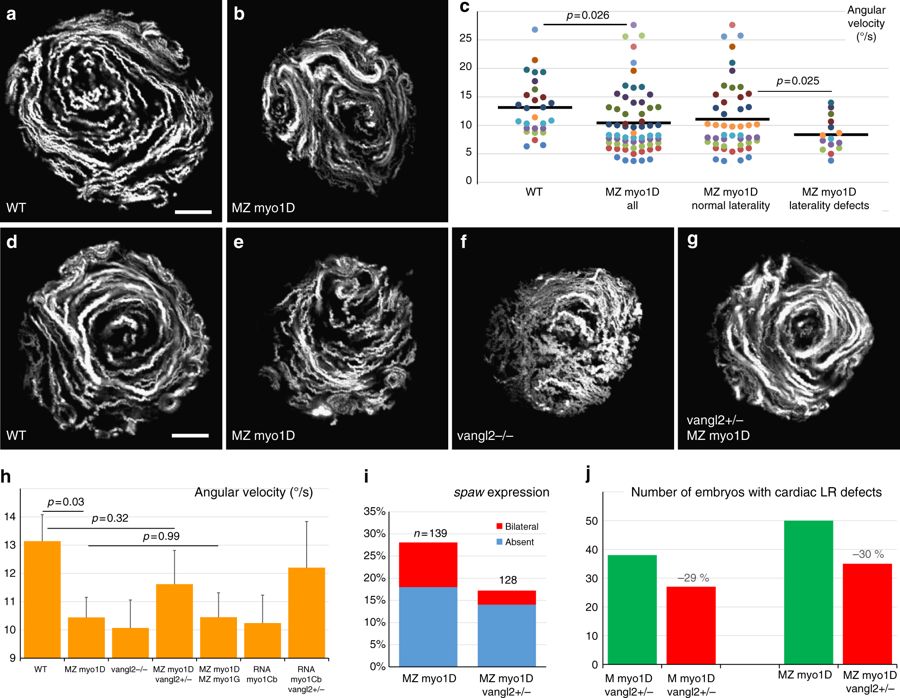
Fig. 4
myo1D is required for the establishment of zebrafish left–right organizer flow. a–c KV flow is altered in MZ myo1D mutants. Temporal projections of the trajectories of fluorescent microspheres in WT (a, n = 28) and MZ myo1D mutants (b, n = 63). c MZ myo1D embryos display lower mean angular KV flow velocities than WT. MZ myo1D mutants with defective cardiac jogging show lower velocities than their sibling with normal laterality. d–g MZ myo1D (e) and vangl2 (f, n = 36) mutants present an altered LRO flow compared to WT (d) but flow pattern is restored in MZ myo1D ; vangl2+/− (g, n = 25). h MZ myo1D mutants display a reduced KV flow velocity compared to WT, as do vangl2−/− embryos (p = 0.03). Flow in MZ myo1D ; vangl2+/− is however similar to WT. Flow velocity in MZ myo1D; MZ myo1G double mutants is reduced compared to WT (n = 29, p = 0.04) but similar to MZ myo1D single mutants. Flow velocity in WT embryos injected with myo1Cb RNA is reduced compared to WT controls (n = 37, p = 0.04). Removal of one copy of vangl2 makes flow velocity again similar to WT (n = 19, p = 0.62). i, j The removal of one copy of vangl2 reduces defects in asymmetric spaw expression (i) and cardiac morphogenesis (j) in MZ myo1D (see Methods). a, b, d–g are dorsal views of eight-somites stage KVs, anterior up. Display items and quantifications in a–h are derived from the same dataset. Horizontal bars in c represent mean values. Error bars in h indicate SEM. Scale bars: 20 µm in a, b, d–g