
- Title
-
Rnf152 Is Essential for NeuroD Expression and Delta-Notch Signaling in the Zebrafish Embryos
- Authors
- Kumar, A., Huh, T.L., Choe, J., Rhee, M.
- Source
- Full text @ Mol. Cells
(A–C) Lateral view; |
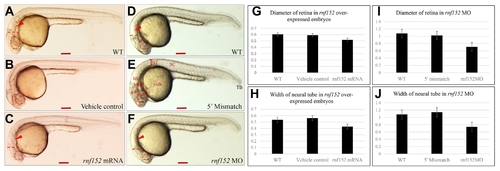
(A) WT zebrafish embryo, (B) vehicle control injected with the same volume of phenol red dye in distilled water as the volume of the mRNAs injected, and (C) PHENOTYPE:
|
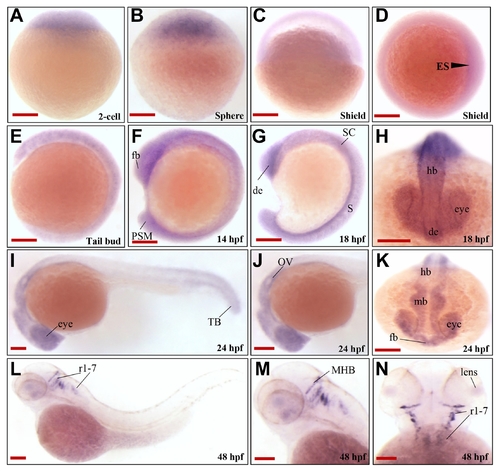
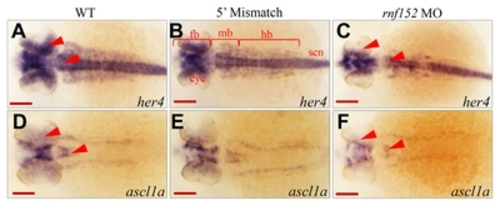
Two color WISH analysis with |
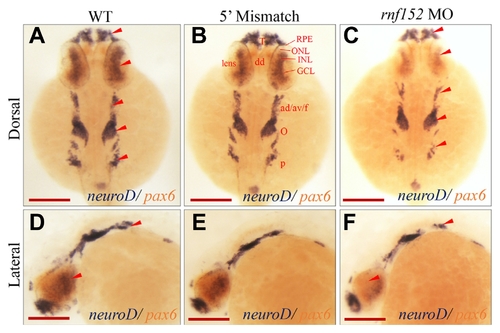
WISH analysis of |
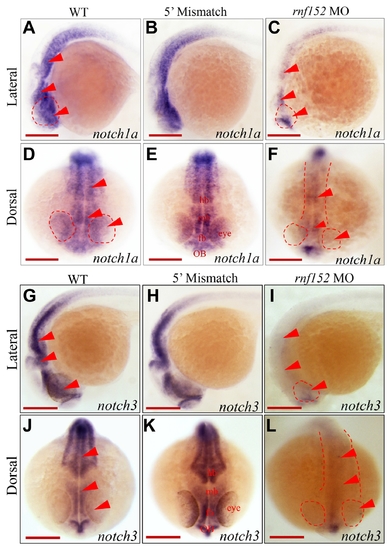
WISH analysis of |
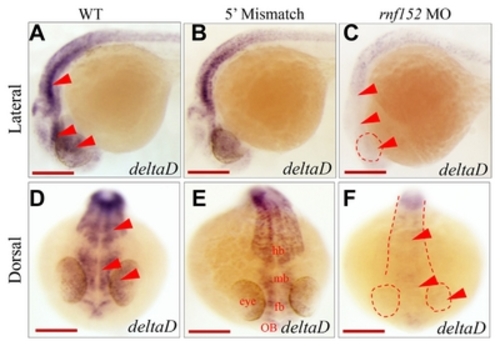
(A–F) Dorsal view of embryos at 29 hpf. WISH analysis with |
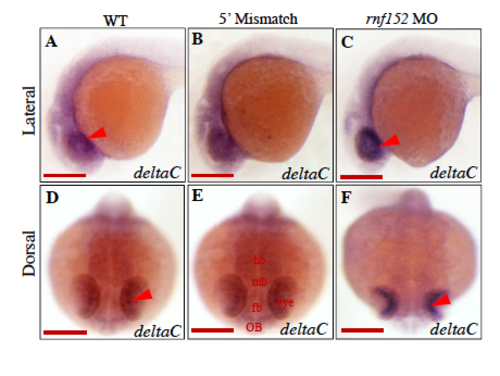
Level of deltaC transcripts is elevated in rnf152 morphants. rnf152 MO were analyzed with WISH using deltaC as a probe. (A&D) WT embryos, (B&E) embryos injected with 5' mismatch as control, and (C&F) embryos injected with rnf152 MO. deltaC transcripts were abundant in the ONL and INL of the eyes, but low in the forebrain, midbrain, and hindbrain of WT (A&D) and 5' mismatch (B&D). However Level of deltaC transcripts was significatnly elevated in the ONL, INL, and GCL of the eye (C&F). Red arrows indicate the layers of eyes where level of deltaC transcripts were elevated at 24 hpf (=3). Scale bars A-F: 50 μm. |
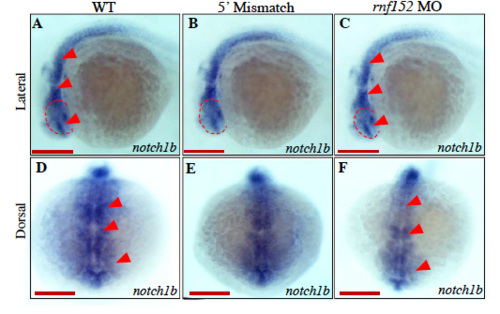
Transcripts of notch1b is not effected by rnf152 knock-down. WISH analysis with notch1b transcripts in rnf152 MO. (A&D) WT embryos, (B&E) Embryos injected with 5' mismatch MO control, and (C&F) Embryos injected with rnf152 MO. Level of notch1b transcripts was similar among the three groups. dotted red circles indicate eyes. Red arrowheads indicate eyes, midbrain and hindbrain at 24 hpf (n=3). Scale bars A-F: 50 μm EXPRESSION / LABELING:
|
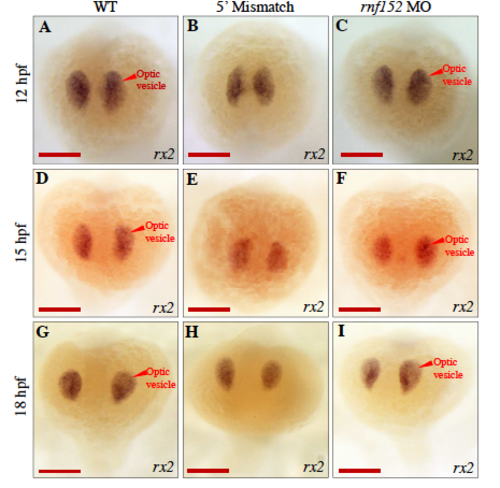
WISH analysis of WT and rnf152 MO with rx2- specific probe identified alteriations in the optic vesicles at 12,15, and 18 hpf. (A-C) 12 hpf, (D-F) 15 hpf, and (G-I) 18 hpf. (A,D,&G) WT embryos, (B,E,&H) Embryos injected with 5' mismatch control morpholino, and (C,F,&I) Embryos injected with rnf152 morpholino. Level of rx2 transcripts did not show significant differences in the optic vesicles among WT, 5' mismatch control, and rnf152 MO at 12, 15, and 18 hpf. Red arrowheads indicate optic vesicle of the embryo (n=3). Scale Bars A-I: 50 μm. EXPRESSION / LABELING:
|