IMAGE

Fig. 7

ID
ZDB-IMAGE-180509-16
Genes
Source
Figures for Kumar et al., 2017
Image
Figure Caption

Fig. 7

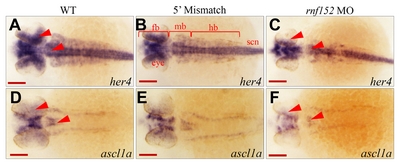
(A–F) Dorsal view of embryos at 29 hpf. WISH analysis with her4 detected the transcripts in the eyes, forebrain, mid-hindbrain, and spinal cord of the WT (A) and 5′ mismatch control (B) while they disappeared in the eye and rhombomeres of rnf152 MO (C). Red arrowheads indicate her4 transcripts in the eyes and anterior rhombomeres (n = 3). WISH analysis with ascl1a found that ascl1a transcripts in the eyes, forebrain and mid-hindbrain of the two control groups but were significantly reduced in those of rnf152 MO. Red arrowheads indicate the eyes and rhombomeres (n = 3). Abbreviations: fb- forebrain, mb- midbrain, hb- hindbrain, ret- retina. Scale bars (A–F): 50 μm.

Figure Data
Acknowledgments
This image is the copyrighted work of the attributed author or publisher, and ZFIN has permission only to display this image to its users. Additional permissions should be obtained from the applicable author or publisher of the image. Full text @ Mol. Cells