
- Title
-
Comparative analysis of monoaminergic cerebrospinal fluid-contacting cells in Osteichthyes (bony vertebrates)
- Authors
- Xavier, A.L., Fontaine, R., Bloch, S., Affaticati, P., Jenett, A., Demarque, M., Vernier, P., Yamamoto, K.
- Source
- Full text @ J. Comp. Neurol.
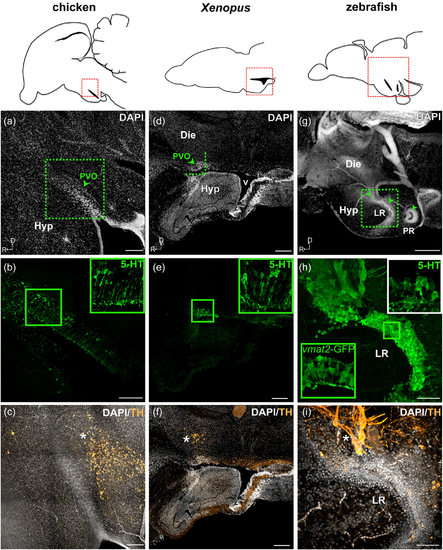
Monoaminergic CSF-c cells of chicken, Xenopus, and zebrafish in relation to the organization of the hypothalamic ventricle. Schematic drawings of sagittal sections of chicken, Xenopus, and zebrafish brains are shown in the top panels, and for each species, micrographs of the red squared areas are shown below (a–c for chicken, d–f for Xenopus, and g–i for zebrafish). DAPI staining (gray) delineates the recesses of the hypothalamic ventricle. Confocal images (Z-projection = 10 µm) with higher magnification obtained from the area depicted in (a) (dashed green square) show 5-HT+ CSF-c cells (green) aligned along the dorsal side of the hypothalamic recess (b; inset at higher magnification). TH immunoreactive cells (orange) are not observed within the PVO (arrowhead), but are abundant in the area dorsocaudal to it (c; asterisk). In the Xenopus sagittal section close to the midline, PVO (d; arrowhead) is observed at the anterior edge of the large ventricle (v). The PVO is visualized with 5-HT+ CSF-c cells (e; green; inset at higher magnification). TH immunoreactive cells (orange) are observed dorsal to the PVO (f; asterisk). In zebrafish, three CSF-c cell populations (locations indicated by arrowheads in g) are located around two hypothalamic recesses. The two anterior CSF-c cell populations are located in front of and around the lateral recess (LR), while the posterior population surrounds the posterior recess (PR). Higher magnification of the squared area in (g) is shown in (h) and (i) (Z-projection = 10 µm). CSF-c cells revealed by the expression of GFP in the enhancer trap transgenic line ETvmat2:GFP (vmat2-GFP; green inset) are lined along the ventricular zone (h). The white inset in (h) shows the 5-HT labeling in the same area (the image is taken from a different sample). TH immunoreactive cells (orange) are found dorsal to the LR (i; asterisk). D = dorsal; Die = diencephalon; Hyp = hypothalamus; LR = lateral recess; PR = posterior recess; PVO = paraventricular organ; R = rostral; v = ventricle. Scale bar = 200 µm in (a–g); 50 µm in (h, i) |
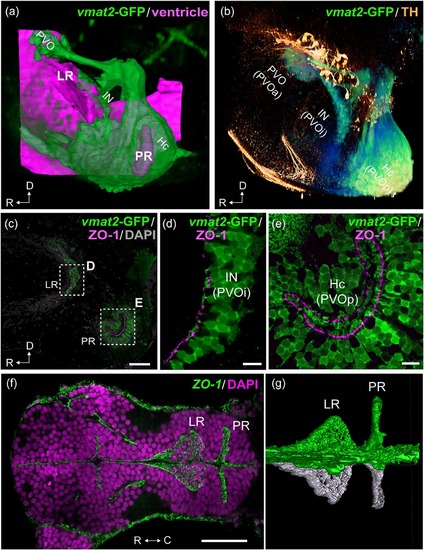
Organization of the two hypothalamic recesses in zebrafish. The hypothalamic area of adult (a–e; sagittal view) and embryonic (f, g; horizontal view) zebrafish brains are shown. The anterior is to the left in all figures. 3D visualization of the images of (a) and (b) are shown in the Supporting Information Figures S1 and S2 respectively. (a) The three vmat2-GFP CSF-c cells (green; PVO, IN, and Hc) are organized around the two hypothalamic recesses, namely the lateral recess (LR) and the posterior recess (PR). The CSF-c cells (green) are visualized using an enhancer trap vmat2:GFP zebrafish line, and the ventricular zone (magenta) is reconstructed from ventricular surfaces delineated by DiI staining. (b) Immunolabeling for vmat2-GFP (green) and TH (orange). Prominent TH-immunopositive cells (orange) are found dorsal to the CSF-c cells populations (green): PVO, IN, and Hc, which are alternatively named PVOa, PVOi, and PVOp. (c–e) Adult hypothalamic recesses double labeled for vmat2-GFP and ZO-1. The areas delimited by dashed rectangles in (c) are shown in (d) and (e), which demonstrate the end feet of the process of CSF-c cells bathing in the ventricle. (f, g) The ZO-1 immunolabeling in the developing brain (48 hr postfertilization), demonstrating that the LR and PR are separate ventricular extension from early embryonic stages. (g) shows 3D semiautomatic segmentation of the ZO-1 immunolabeling in the LR and PR shown in (f). The right hemisphere and the midline are visualized in green, while the left hemisphere is visualized in white, to highlight the intricate ventricular organization. C = caudal; D = dorsal; Hc = caudal zone of periventricular hypothalamus; IN = intermediate nucleus of hypothalamus; LR = lateral recess; PR = posterior recess; PVO = paraventricular organ; PVOa = anterior paraventricular organ; PVOi = intermediate paraventricular organ; PVOp = posterior paraventricular organ; R = rostral. Scale bars = 50 µm in (c) and (f); 10 µm in (d) and (e) |
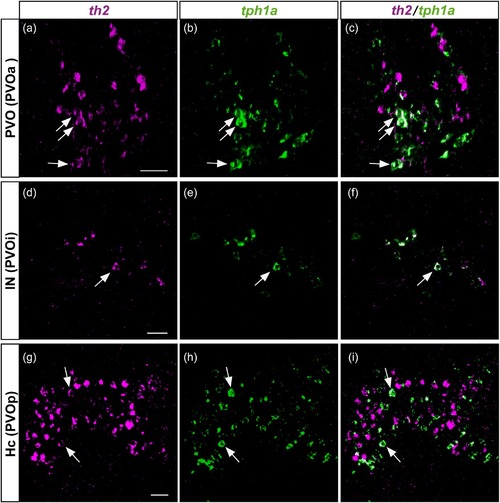
Colocalization of th2 and tph1a in the three CSF-c cell populations of zebrafish. Frontal sections of the adult zebrafish brain showing the three CSF-c cell populations, PVO (a–c), IN (d–f), and Hc (g–i), which are also known as PVOa, PVOi, and PVOp, respectively. Single confocal planes show that th2 (magenta) and tph1a (green) are found in the same cell population, and some cells coexpress both of them (arrows). Scale bar = 20 µm |
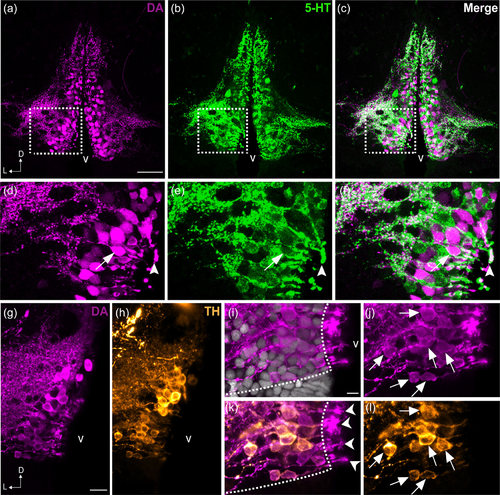
Colocalization of DA and 5-HT in the PVO cells of zebrafish. Frontal sections of the anterior PVO (PVOa) in adult zebrafish demonstrate that CSF-c cells are immunoreactive to DA (magenta; a, d) and to 5-HT (green; b, e). The areas in dashed rectangles in (a), (b), and (c) are shown at higher magnification (Z-projection = 5 µm) in (d), (e), and (f) respectively. Both monoamines were observed in a few cell bodies (arrow in f) and endfeet (arrowhead in f). In teleosts, some of the DA+ CSF-c cells (g) are also immunoreactive for TH (h; orange). Higher magnification images of the PVO are shown in (i–l). In CSF-c cells, intense DA immunoreactivity is present in the cell soma (j; arrows), processes, and the endfeet contacting the ventricle (k; arrowheads). In contrast, intense TH immunoreactivity is mostly observed in the soma and processes (l; arrows), but not in the endfeet. D = dorsal; L = lateral; v = ventricle. Scale bar = 50 µm in (a) (applies to a, b, c); 200 µm in (g) (applies to g, h); 100 µm in (i) (applies to i, j, k, l) |
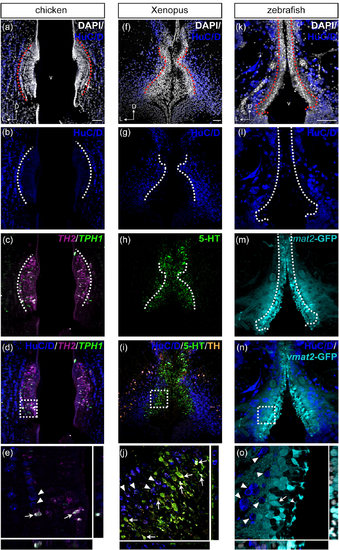
Comparison of HuC/D immunoreactivity in the anterior PVO cell populations in chicken, Xenopus, and zebrafish. Frontal sections of the anterior PVO of chicken (a–e), Xenopus (f–j), and zebrafish (k–o) are shown. The HuC/D immunoreactivity (dark blue) is absent in the PVO, where monoaminergic CSF-c cells are located (dashed lines), in chicken (a–d), Xenopus (f–i), and zebrafish (k–n). The areas within dashed squares in (d), (i), and (n) are shown at higher magnification in (e), (j), and (o), respectively. TH2+/TPH1+ CSF-c cells (white in e; arrows) are not HuC/D+ (e; arrowheads) in the chicken PVO. In the Xenopus PVO as well, monoaminergic 5-HT+/TH+ CSF-c cells (j; arrows) are not immunolabeled by HuC/D, whereas TH+ adjacent to the PVO are HuC/D+ (j; arrowheads). Similarly, CSF-c cells that express GFP in the enhancer trap transgenic line ETvmat2:GFP (vmat2-GFP; cyan) are HuC/D- (n). HuC/D+ cells (o; arrowheads) are adjacent to vmat2-GFP cells (o; arrow) whose process bathes the ventricle (o; curved arrowhead). D = dorsal; L = lateral; v = ventricle. Scale bar = 50 µm in (a) (applies to a, b, c, d); 50 µm in (f) (applies to f, g, h, i); 50 µm in (k) (applies to k, l, m, n) |
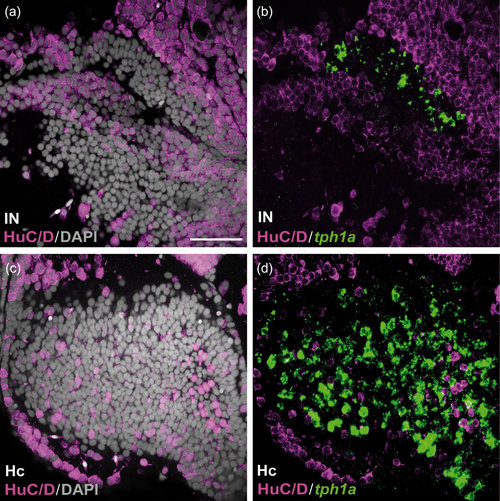
HuC/D immunoreactivity in the caudal CSF-c cell populations in zebrafish. Frontal sections of the zebrafish IN (a and b) and Hc (c and d), with the midline to the left. Gray represents DAPI staining. The tph1a+ CSF-c cells (green) are negative for HuC/D (magenta). Scale bar = 50 µm (applies to a, b, c, d) |