
|
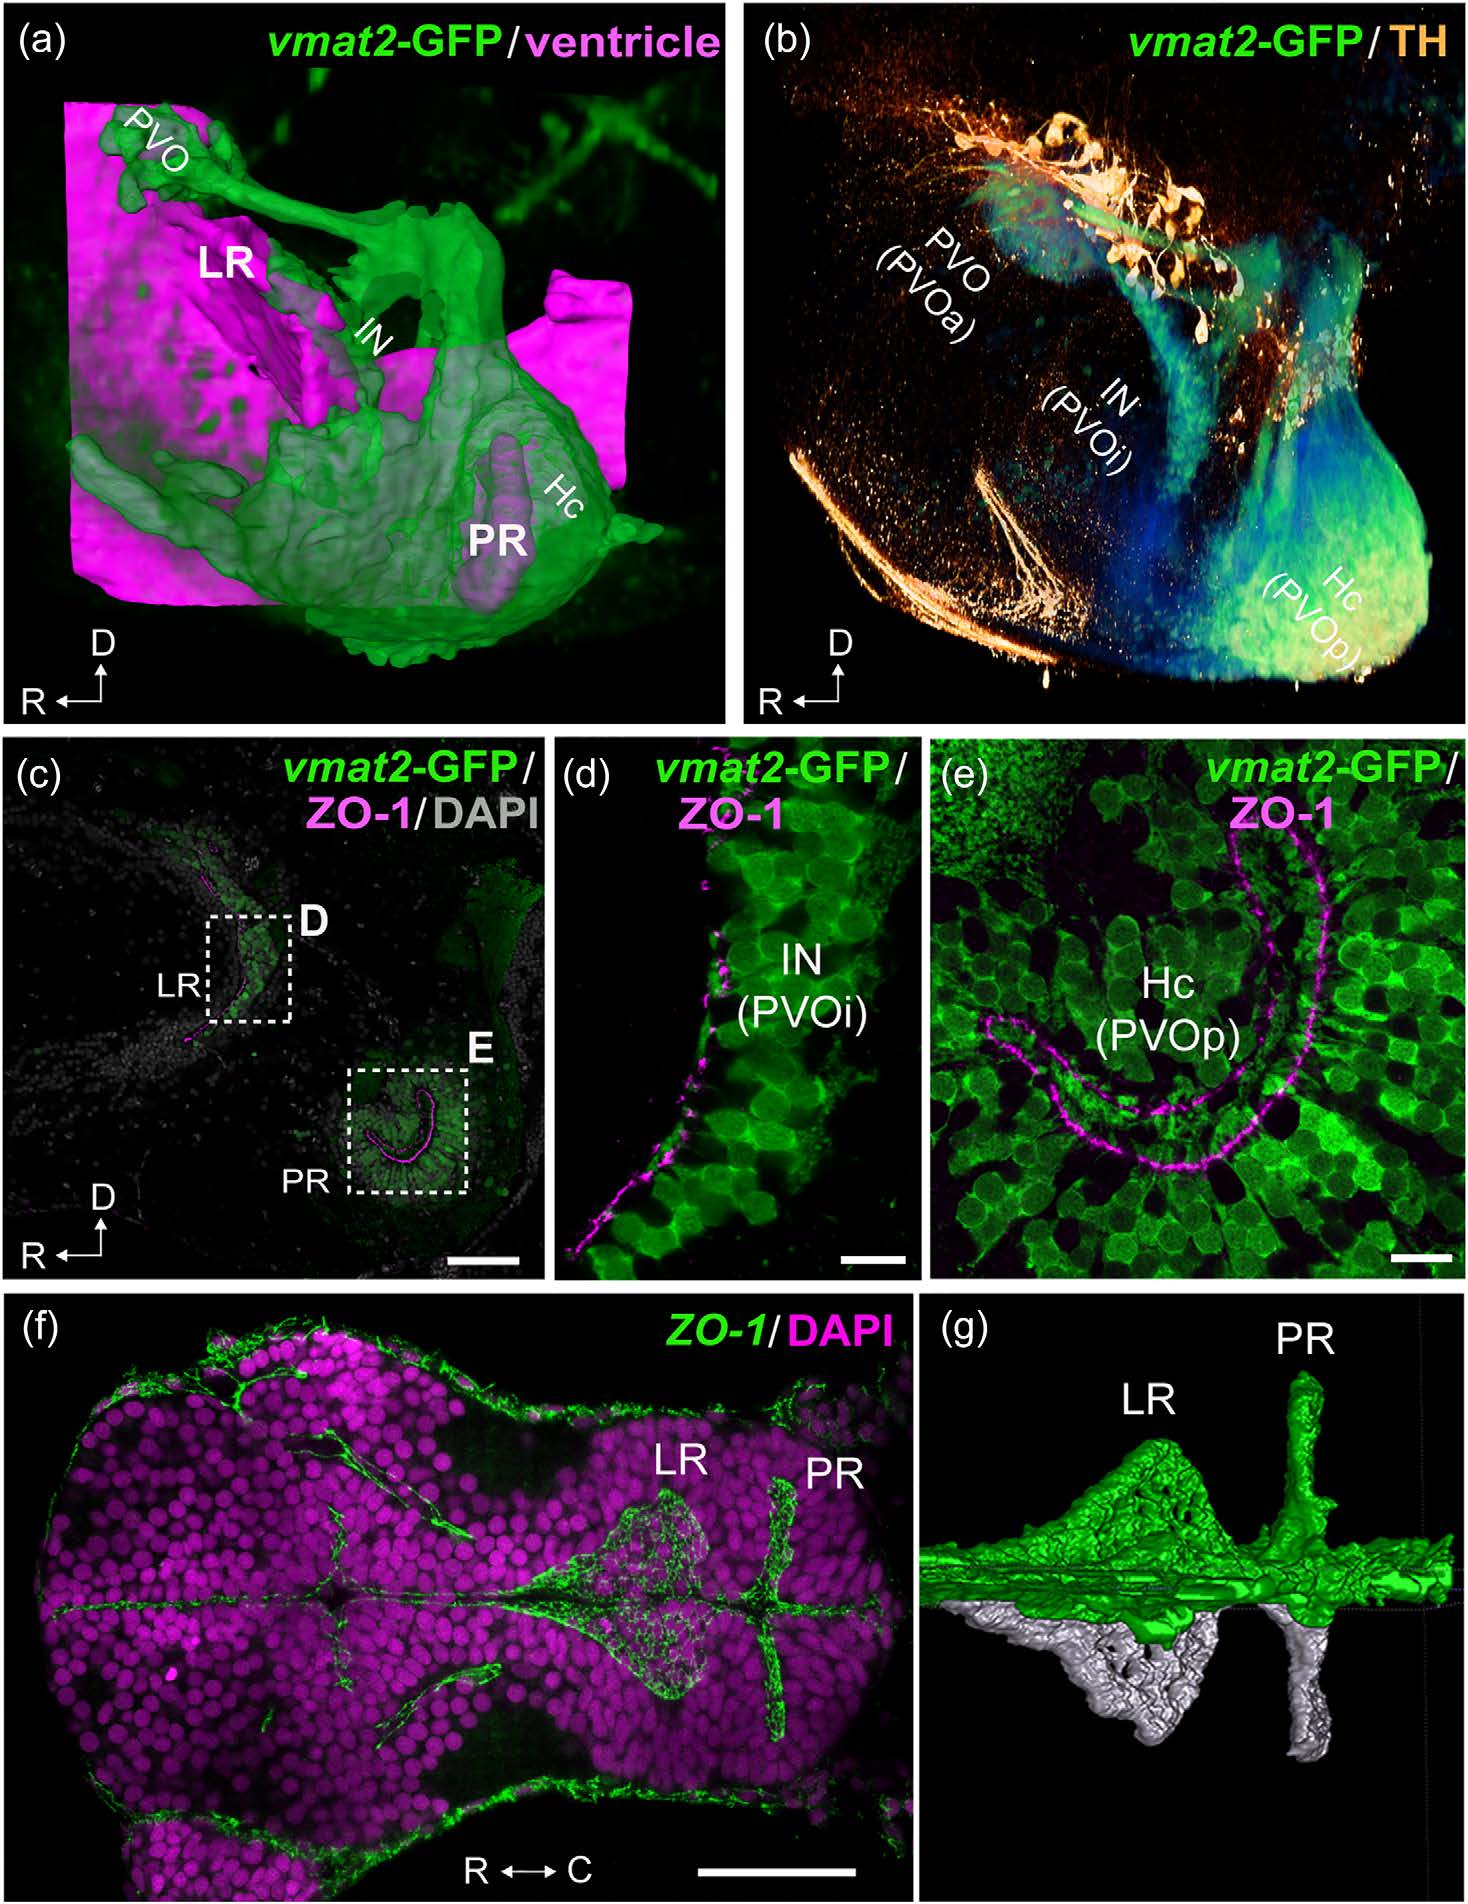
Fig. 3
Organization of the two hypothalamic recesses in zebrafish. The hypothalamic area of adult (a–e; sagittal view) and embryonic (f, g; horizontal view) zebrafish brains are shown. The anterior is to the left in all figures. 3D visualization of the images of (a) and (b) are shown in the Supporting Information Figures S1 and S2 respectively. (a) The three vmat2-GFP CSF-c cells (green; PVO, IN, and Hc) are organized around the two hypothalamic recesses, namely the lateral recess (LR) and the posterior recess (PR). The CSF-c cells (green) are visualized using an enhancer trap vmat2:GFP zebrafish line, and the ventricular zone (magenta) is reconstructed from ventricular surfaces delineated by DiI staining. (b) Immunolabeling for vmat2-GFP (green) and TH (orange). Prominent TH-immunopositive cells (orange) are found dorsal to the CSF-c cells populations (green): PVO, IN, and Hc, which are alternatively named PVOa, PVOi, and PVOp. (c–e) Adult hypothalamic recesses double labeled for vmat2-GFP and ZO-1. The areas delimited by dashed rectangles in (c) are shown in (d) and (e), which demonstrate the end feet of the process of CSF-c cells bathing in the ventricle. (f, g) The ZO-1 immunolabeling in the developing brain (48 hr postfertilization), demonstrating that the LR and PR are separate ventricular extension from early embryonic stages. (g) shows 3D semiautomatic segmentation of the ZO-1 immunolabeling in the LR and PR shown in (f). The right hemisphere and the midline are visualized in green, while the left hemisphere is visualized in white, to highlight the intricate ventricular organization. C = caudal; D = dorsal; Hc = caudal zone of periventricular hypothalamus; IN = intermediate nucleus of hypothalamus; LR = lateral recess; PR = posterior recess; PVO = paraventricular organ; PVOa = anterior paraventricular organ; PVOi = intermediate paraventricular organ; PVOp = posterior paraventricular organ; R = rostral. Scale bars = 50 µm in (c) and (f); 10 µm in (d) and (e)