
Image
|
Figure Caption
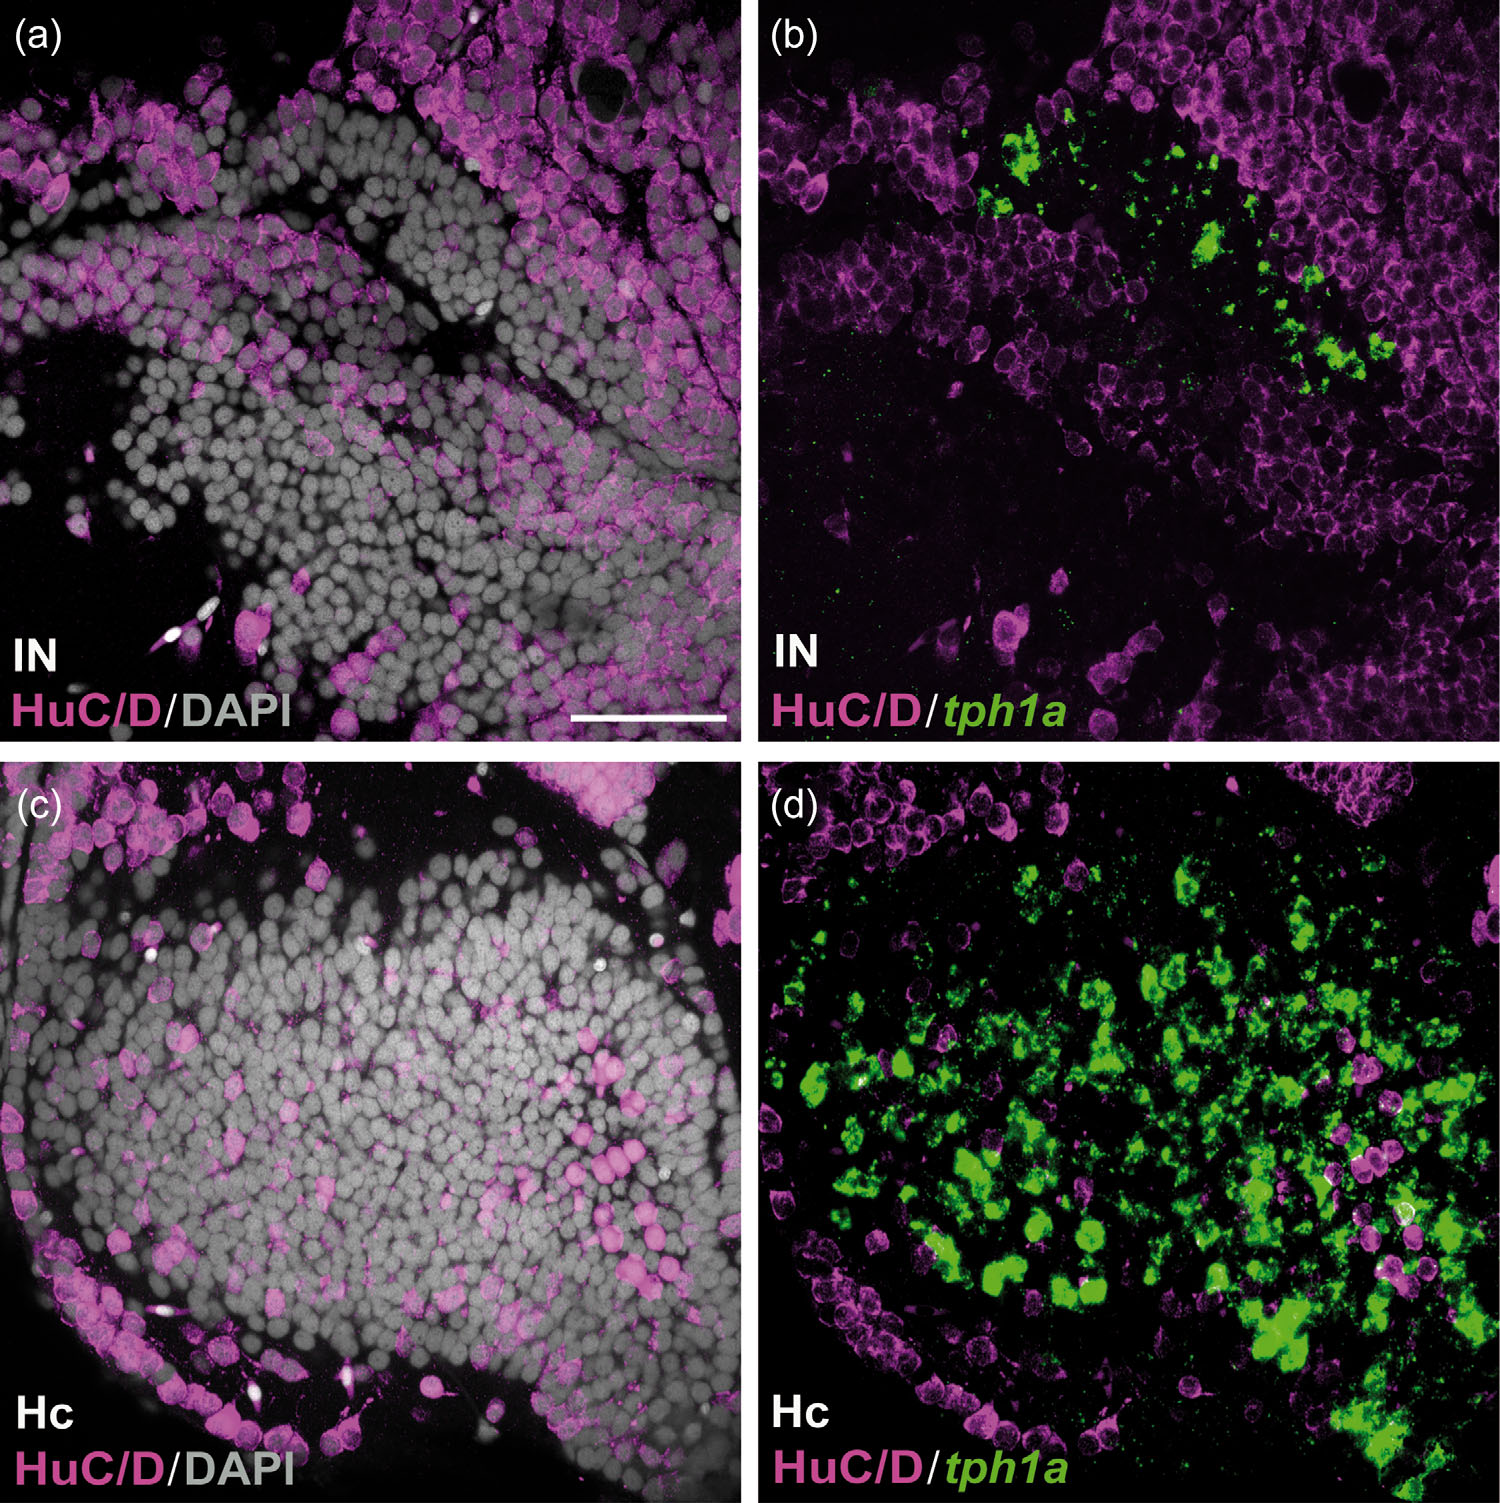
Fig. 11
HuC/D immunoreactivity in the caudal CSF-c cell populations in zebrafish. Frontal sections of the zebrafish IN (a and b) and Hc (c and d), with the midline to the left. Gray represents DAPI staining. The tph1a+ CSF-c cells (green) are negative for HuC/D (magenta). Scale bar = 50 µm (applies to a, b, c, d)
Acknowledgments
This image is the copyrighted work of the attributed author or publisher, and
ZFIN has permission only to display this image to its users.
Additional permissions should be obtained from the applicable author or publisher of the image.
Full text @ J. Comp. Neurol.