
Fig. 10
- ID
- ZDB-FIG-170522-16
- Publication
- Xavier et al., 2017 - Comparative analysis of monoaminergic cerebrospinal fluid-contacting cells in Osteichthyes (bony vertebrates)
- Other Figures
- All Figure Page
- Back to All Figure Page
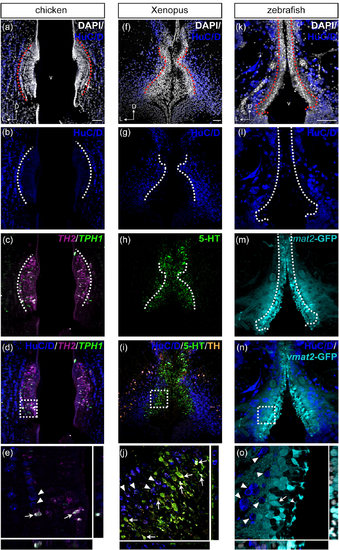
Comparison of HuC/D immunoreactivity in the anterior PVO cell populations in chicken, Xenopus, and zebrafish. Frontal sections of the anterior PVO of chicken (a–e), Xenopus (f–j), and zebrafish (k–o) are shown. The HuC/D immunoreactivity (dark blue) is absent in the PVO, where monoaminergic CSF-c cells are located (dashed lines), in chicken (a–d), Xenopus (f–i), and zebrafish (k–n). The areas within dashed squares in (d), (i), and (n) are shown at higher magnification in (e), (j), and (o), respectively. TH2+/TPH1+ CSF-c cells (white in e; arrows) are not HuC/D+ (e; arrowheads) in the chicken PVO. In the Xenopus PVO as well, monoaminergic 5-HT+/TH+ CSF-c cells (j; arrows) are not immunolabeled by HuC/D, whereas TH+ adjacent to the PVO are HuC/D+ (j; arrowheads). Similarly, CSF-c cells that express GFP in the enhancer trap transgenic line ETvmat2:GFP (vmat2-GFP; cyan) are HuC/D- (n). HuC/D+ cells (o; arrowheads) are adjacent to vmat2-GFP cells (o; arrow) whose process bathes the ventricle (o; curved arrowhead). D = dorsal; L = lateral; v = ventricle. Scale bar = 50 µm in (a) (applies to a, b, c, d); 50 µm in (f) (applies to f, g, h, i); 50 µm in (k) (applies to k, l, m, n) |