- Title
-
In Vivo Visualization of Cardiomyocyte Apicobasal Polarity Reveals Epithelial to Mesenchymal-like Transition during Cardiac Trabeculation
- Authors
- Jiménez-Amilburu, V., Rasouli, S.J., Staudt, D.W., Nakajima, H., Chiba, A., Mochizuki, N., Stainier, D.Y.
- Source
- Full text @ Cell Rep.
|
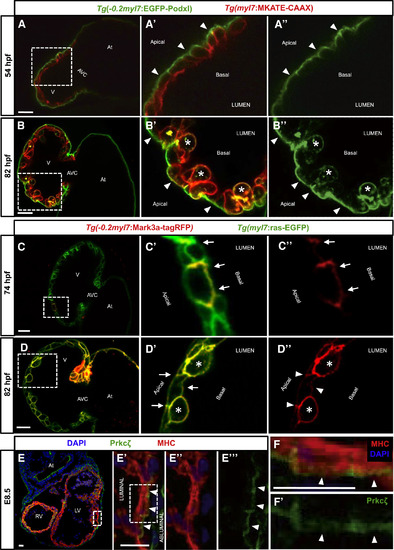
Establishment of Apicobasal Polarity in CMs (A–B'') Confocal images (mid-sagittal sections) of Tg(−0.2myl7:EGFP-podxl);Tg(myl7:MKATE-CAAX) zebrafish hearts at 54 (A–A'') and 82 (B–B'') hpf. Boxed area in (A) is shown in (A') and (A''). EGFP-Podxl is restricted to the abluminal membrane of CMs (A' and A'', arrowheads). Boxed area in (B) is shown in (B') and (B''). EGFP-Podxl is observed all around the membrane of delaminated CMs (B' and B'', asterisks), while it remains apical in compact-layer CMs (B' and B'', arrowheads). (C–D'') Confocal images (mid-sagittal sections) of 74-hpf (C–C'') and 82-hpf (D–D'') Tg(myl7:ras-EGFP) larvae injected with −0.2myl7:mark3a-TagRFP-T plasmid. Boxed area in (C) is shown in (C') and (C''). Mark3a-TagRFP-T, a basolateral marker, is restricted to the luminal and lateral membranes of CMs (C and C'', arrows). Boxed area in (D) is shown in (D') and (D''). Mark3a-TagRFP-T is observed all around the membrane of delaminated CMs (D' and D'', asterisks), while it remains basolateral in compact-layer CMs (D' and D'', arrowheads). (E–E'') E8.5 mouse heart co-stained for Prkcζ (green), myosin heavy chain (MHC) (red), and DAPI (blue). High-magnification images show the localization of the apical protein Prkcζ in the abluminal membrane of CMs (E' and E''', arrowheads). (F–F') High-magnification images of a single mouse cardiomyocyte showing abluminal localization of Prkcζ (F and F', arrowheads). Boxed area in (E') is shown in (F) and (F'). At, atrium; V, ventricle; AVC, atrioventricular canal; RV, right ventricle; LF, left ventricle. Scale bars, 20 μm. EXPRESSION / LABELING:
|
|
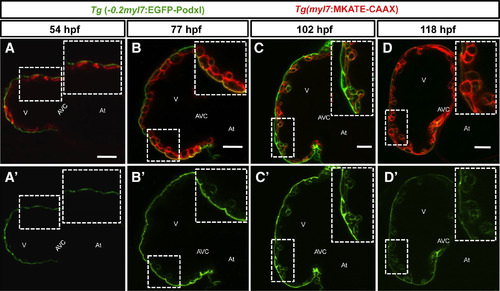
EGFP-Podocalyxin Localization in CMs during Cardiac Trabeculation (A–D') Confocal images (mid-sagittal sections) of Tg(−0.2myl7:EGFP-podxl);Tg(myl7:MKATE-CAAX) zebrafish hearts at 54 (A and A'), 77 (B and B'), 102 (C and C'), and 118 (D and D′) hpf. Boxed areas show high-magnification images of MKATE-CAAX and/or EGFP-Podxl expression (A–D'). Compact-layer CMs remain polarized at least until 118 hpf. At, atrium; V, ventricle; AVC, atrioventricular canal. Scale bars, 20 μm. |
|
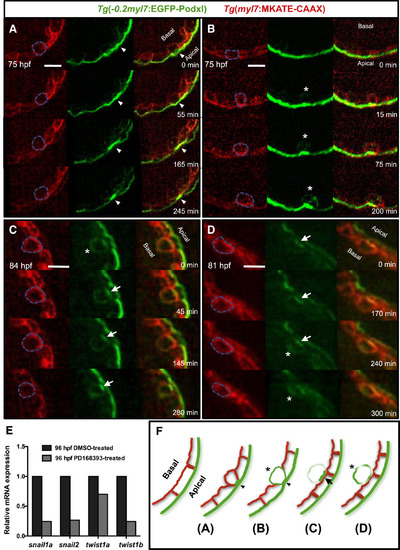
Live Imaging at Single-Cell Resolution of CM Polarization during Cardiac Trabeculation (A–D) Time-lapse movies of Tg(−0.2myl7:EGFP-podxl);Tg(myl7:MKATE-CAAX) beating zebrafish hearts between 75 and 90 hpf. (A) Apical constriction of a compact-layer CM; arrowheads point to the progressive condensation of EGFP-Podxl expression over time. Single-plane images taken from Movie S1. (B) CM depolarization prior to delamination; asterisks indicate the depolarized CM. Single-plane images taken from Movie S2. (C) Re-polarization is sometimes observed once CMs delaminate and enter the trabecular layer; asterisks indicate depolarized CM, and arrows point to subsequent EGFP-Podxl enrichment on one side of the CM. Single-plane images taken from Movie S3. (D) Second depolarization event in the trabecular layer; arrows point to EGFP-Podxl enrichment, and asterisks indicate the new depolarization event. Single-plane images taken from Movie S4. (E) qPCR analysis of snail1a, snail2, twist1a, and twist1b expression in 96-hpf zebrafish hearts from DMSO- and PD168393-treated larvae (treated from 55 to 96 hpf). (F) Cartoons illustrating the changes in CM polarization during trabeculation. Blue dashed lines outline the delaminating CMs examined (A–D). Scale bars, 10 μm. EXPRESSION / LABELING:
PHENOTYPE:
|
|
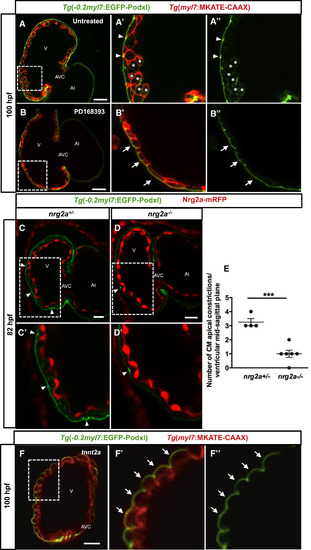
CM Depolarization Is Nrg/ErbB2 Signaling-, and Blood Flow- and Cardiac Contractility-Dependent (A–B'') Confocal images (mid-sagittal sections) of 100-hpf Tg(−0.2myl7:EGFP-podxl);Tg(myl7:MKATE-CAAX) zebrafish hearts. Boxed area in (A) is shown in (A') and (A''). Untreated larvae show apical constrictions (A' and A'', arrowheads) and depolarized CMs (A' and A'', asterisks). (B–B''). Larvae treated with 10 μM PD168393 from 56 to 100 hpf exhibit no apical constrictions or depolarized CMs (B' and B'', arrows). Boxed areas in (B) are shown in (B') and (B''). (C–D') Confocal images (mid-sagittal sections) of 82-hpf Tg(−0.2myl7:EGFP-podxl) zebrafish hearts from a nrg2a+/− incross. Boxed areas in (C) and (D) are shown in (C') and (D'). Heterozygous larvae (nrg2a+/−) exhibit an average of three apical constrictions per ventricle at the mid-sagittal plane (C and C′, arrowheads), while homozygous mutants (nrg2a−/−) exhibit a reduced number of apical constrictions (D and D', arrowheads). (E) Graph showing the number of apical constrictions in nrg2a heterozygous and homozygous mutant larvae; n = 4 and n = 6, respectively. Each dot represents one heart. Data are shown as mean ± SEM. ∗∗∗p < 0.001 by Student’s t test. (F–F'') 100-hpf tnnt2a morphant hearts exhibit no apical constrictions or depolarized CMs (F' and F'', arrows). Boxed areas in (F) are shown in (F') and (F''). At, atrium; V, ventricle; AVC, atrioventricular canal. Scale bars, 20 μm. EXPRESSION / LABELING:
PHENOTYPE:
|
|
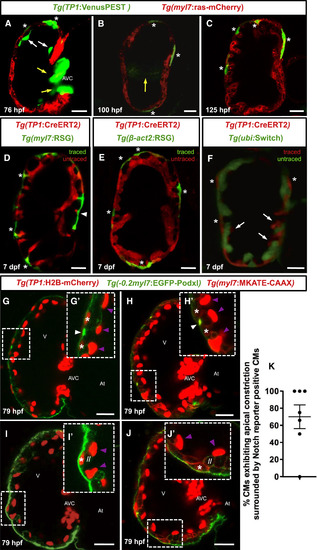
Notch-Signaling-Reporter-Positive CMs Appear in the Compact Layer Adjacent to CMs Undergoing Apical Constriction (A–C) Confocal images (mid-sagittal sections) of Tg(myl7:ras-mCherry);Tg(TP1:VenusPEST) zebrafish larvae at 76 (A), 100 (B), and 125 (C) hpf. Asterisks indicate CMs expressing the Notch signaling reporter. White arrows in (A) point to fading TP1:VenusPEST expression in the endocardium. Yellow arrows point to the developing AV valve in (A) and (B). (D–F) Confocal sections of 7-dpf larval hearts obtained from crossing the Tg(TP1:CreERT2) line to three different indicator lines. In each case, embryos were treated with 4-OHT from 2 to 5 dpf. Asterisks indicate labeled CMs in the compact layer. (D) Lineage-traced 7-dpf Tg(TP1:CreERT2);Tg(myl7:RSG) heart. Arrowhead points to a CM neighboring the AV canal. (E) Lineage-traced 7 dpf Tg(TP1:CreERT2);Tg(β-act2:RSG) heart. (F) Lineage-traced 7 dpf Tg(TP1:CreERT2);Tg(ubi:Switch) heart. Note that in this case, lineage-traced cells are red. White arrows point to labeled endocardial cells. (G–J') Confocal images (mid-sagittal sections) of 79-hpf Tg(−0.2myl7:EGFP-podxl);Tg(myl7:MKATE-CAAX);Tg(TP1:H2B-mCherry) zebrafish hearts. Boxed areas in (G) and (H) are shown in G' and H', respectively. Notch-reporter-positive CMs (G' and H', asterisks) localize in the compact layer adjacent to CMs undergoing apical constriction (G' and H', white arrowheads). Boxed areas in (I) and (J) are shown in (I') and (J'), respectively. Notch-reporter-positive CMs (I' and J', asterisks) appear directly adjacent to a delaminated CM (I' and J', //). Purple arrowheads point to Notch-reporter-positive endocardial cells (G', H', I', and J'). (K) Graph shows percentage of CMs exhibiting apical constriction that are surrounded by Notch-reporter-positive CMs per heart at 79 hpf. Each dot represents one heart. At, atrium; V, ventricle; AVC, atrioventricular canal. Scale bars, 20 μm. EXPRESSION / LABELING:
|
|
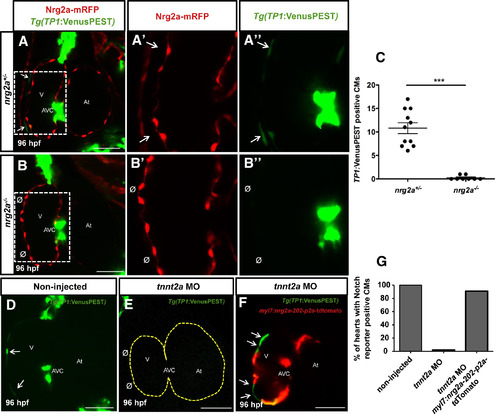
Nrg2a Signaling Is Required for Notch Reporter Activity in Zebrafish CMs (A–D'') Confocal images (mid-sagittal sections) of 96-hpf Tg(TP1:VenusPEST) zebrafish larvae from a nrg2a+/− incross (A–B''). Images show a number of Notch-reporter-positive CMs in the compact layer in the presence of Nrg2a function (A–A'', arrows), while the number of TP1:VenusPEST-positive CMs is dramatically reduced in the absence of Nrg2a function (B–B'', Ø). (C) Graph showing the number of TP1:VenusPEST-positive CMs per 96-hpf heart in nrg2a+/− (n = 11) versus nrg2a−/− (n = 8) larvae. Each dot represents one heart. Data are shown as mean ± SEM. ∗∗∗p < 0.001 by Student’s t test. (D–F) Confocal images (mid-sagittal section) of 96-hpf Tg(TP1:VenusPEST) larval heart. Non-injected larvae show TP1:VenusPEST-positive CMs in the compact layer (D, arrows). tnnt2a morphants show absence of Tg(TP1:VenusPEST) expression in CMs (E, Ø). In tnnt2a morphants, mosaic expression of nrg2a in CMs activates Tg(TP1:VenusPEST) expression in neighboring CMs (F, arrows). (G) Graph shows the percentage of hearts showing TP1:VenusPEST positive CMs at 96 hpf in non-injected larvae (n = 18), tnnt2a morphants (n = 31) and tnnt2a morphants overexpressing nrg2a in the myocardium (n = 23). Yellow dashed line outlines the tnnt2a morphant heart (E). At, atrium; V, ventricle; AVC, atrioventricular canal. Scale bars, 50 μm. |
|
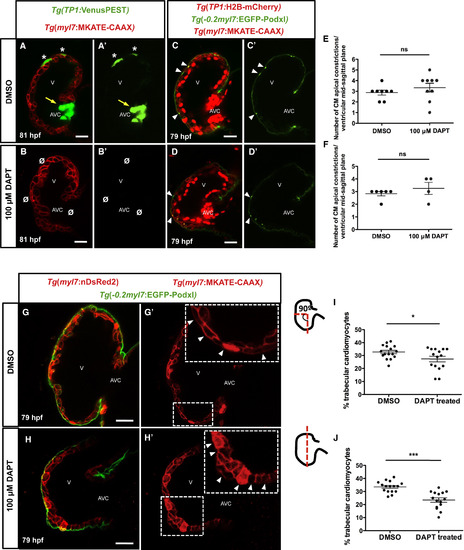
Blocking Notch Activation Did Not Increase the Number of CMs Exhibiting Apical Constriction or of CMs in the Trabecular Layer (A–B') Confocal images (mid-sagittal sections) of 81-hpf Tg(myl7:MKATE-CAAX);Tg(TP1:VenusPEST) zebrafish hearts. DMSO-treated larvae show Notch activity in CMs (A and A', asterisks) and atrioventricular canal (AVC) cells (A and A', yellow arrows). Larvae treated with 100 μM DAPT lack Notch activity in both CMs and AVC cells (B and B', Ø). (C–D') Confocal images (mid-sagittal sections) of 79-hpf Tg(−0.2myl7:EGFP-podxl);Tg(myl7:MKATE-CAAX);Tg(TP1:H2B-mCherry) zebrafish hearts. DMSO-treated larvae show CM apical constrictions (C and C', arrowheads). 79-hpf larvae treated at 48 hpf with 100 μM DAPT show similar numbers of CM apical constrictions than controls (D and D', arrowheads). (E and F) Number of CM apical constrictions per ventricle at the mid-sagittal plane after 100 μM DAPT treatment. Animals were treated at 48 hpf and imaged at 79 hpf (E) or treated at 60 hpf and imaged at 72 hpf (F). Each dot represents one heart. Data are shown as mean ± SEM. ns, no significant differences by Student’s t test. (G–H') Confocal images (mid-sagittal sections) of 79-hpf Tg(−0.2myl7:EGFP-podxl);Tg(myl7:MKATE-CAAX);Tg(myl7:nDsRed2) zebrafish hearts. DMSO-treated larvae show normal CM shape in the compact layer (G', arrowheads), while DAPT-treated larvae show abnormal CM shape (H', arrowheads). (I and J) Graphs showing the percentage of trabecular CMs versus the total number of CMs counted in two regions of the outer curvature. Each dot represents one heart. Data are shown as mean ± SEM. ∗p < 0.05 and ∗∗∗p < 0.001 by Student’s t test. V, ventricle; AVC, atrioventricular canal. Scale bars, 20 μm. EXPRESSION / LABELING:
PHENOTYPE:
|
|
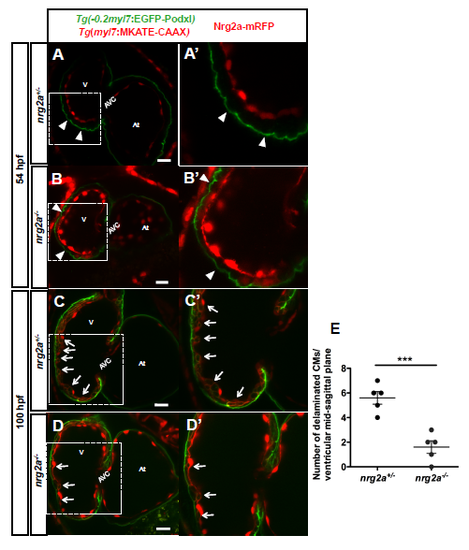
Lower number of delaminated cardiomyocytes in nrg2a mutants (A-D') Confocal images (mid-sagittal sections) of Tg(-0.2myl7:EGFP-podxl);Tg(myl7:MKATECAAX) zebrafish hearts from a nrg2a+/- incross at 52 (A-B') and 100 (C-D') hpf . At 52 hpf, only polarized cardiomyocytes are found in both nrg2a+/- (A and A') and nrg2a-/- (B and B') embryos. Arrowheads point to apical localization of EGFP-Podxl. At 100 hpf, while a high number of delaminated cardiomyocytes are observed in nrg2a+/- larvae (C and C', white arrows), there are only a few delaminated cardiomyocytes in nrg2a-/- larvae (D and D' arrows). (E) Graph showing the number of delaminated cardiomyocytes in 100 hpf nrg2a heterozygous and homozygous mutant larvae, n=5 each. Each dot represents one heart. Data are shown as mean ± SEM. *** P< 0.001 by Student's t-test. At, atrium; V, ventricle; AVC, atrioventricular canal. Scale bars, 20 μm. |
|
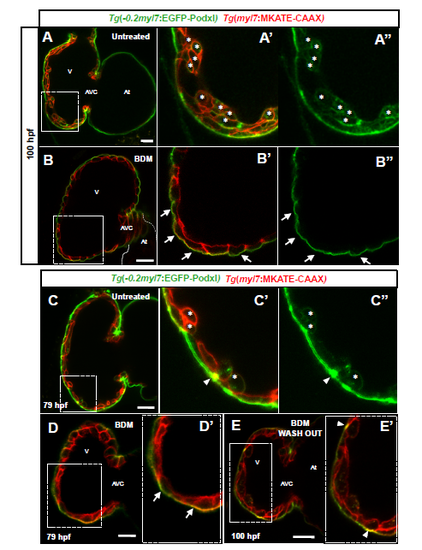
Apical constriction is recovered after restoring blood flow in larval zebrafish hearts (A-B'') Confocal images (mid-sagittal sections) of 100 hpf Tg(-0.2myl7:EGFP-podxl);Tg(myl7:MKATE-CAAX) zebrafish hearts after 20 mM BDM treatment. Boxed area in A shown in A' and A''. Untreated larvae at 100 hpf showing depolarized cardiomyocytes (A' and A'', asterisks). Boxed area in B shown in B' and B''. Larvae were treated at 56 hpf and imaged at 100 hpf. BDM-treated larvae did not exhibit any apical constriction or depolarized cardiomyocytes (B' and B'', arrows). (C-E') Confocal images (mid-sagittal sections) of 79 hpf Tg(-0.2myl7:EGFPpodxl); Tg(myl7:MKATE-CAAX) zebrafish hearts after 20 mM BDM treatment. Boxed area in C shown in C' and C''. Untreated larvae at 79 hpf showing apical constriction (C' and C'', arrowheads) and depolarized cardiomyocytes (C' and C'', asterisks). Boxed area in D shown in D'. Larvae were treated at 72 hpf and imaged at 79 hpf. After 7 hours of treatment, larvae did not exhibit any apical constriction or depolarized cardiomyocyte (D', arrows). Boxed area in E shown in E'. At 79 hpf, BDM was removed and washed out, and larvae were then imaged at 96 hpf. Imaging reveals presence of apical constrictions (E', arrowheads). At, atrium; V, ventricle; AVC, atrioventricular canal. Scale bars, 20 μm. |
|
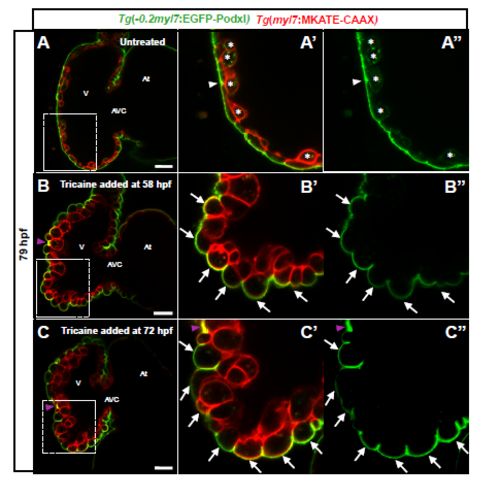
Apical constriction and cardiomyocyte depolarization are blood flow/cardiac contractility dependent (A-C'') Confocal images (mid-sagittal sections) of 79 hpf Tg(-0.2myl7:EGFPpodxl); Tg(myl7:MKATE-CAAX) zebrafish hearts. Tricaine was added at 58 (B-B'') or 72 (CC'') hpf. Boxed area in A shown in A' and A''. Untreated larvae at 79 hpf showing depolarized cardiomyocytes (A' and A'', asterisks) and apical constriction (A' and A'', arrowhead). Boxed area in B and C shown in B', B'' and C' and C'', respectively. At 79 hpf, larvae treated since 58 hpf did not exhibit any apical constriction or depolarized cardiomyocyte (B' and B'', arrows). At 79 hpf, larvae treated with tricaine since 72 hpf did not exhibit any apical constriction or depolarized cardiomyocyte (C' and C'', arrowheads). Purple arrowheads in B and C-C'' point to apical podocalyxin accumulation due to the heart collapse after tricaine exposure. At, atrium; V, ventricle; AVC, atrioventricular canal. Scale bars, 20 μm. |
|
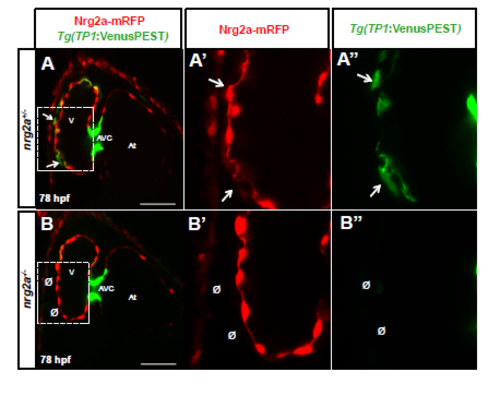
Nrg2a signaling is required for Notch activity in cardiomyocytes (A-B'') Confocal images (mid-sagittal sections) of 78 hpf Tg(TP1:VenusPEST) zebrafish hearts from a nrg2a+/- incross (A-B''). Images show a number of Notch reporter positive compact layer cardiomyocytes in the presence of Nrg2a function (AA'', arrows), while the number of Notch reporter positive cardiomyocytes is dramatically reduced in the absence of Nrg2a function (B-B'', Ø). |
|
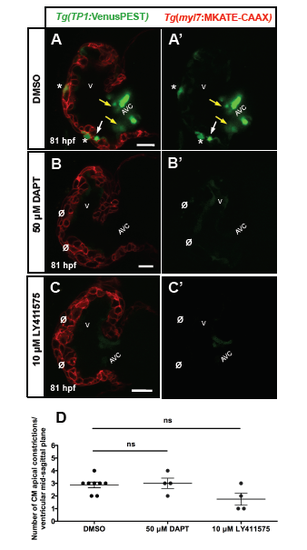
Notch inhibition does not affect cardiomyocyte apical constriction (A-C') Confocal images (mid-sagittal sections) of 81 hpf Tg(myl7:MKATE-CAAX);Tg(TP1:VenusPEST) zebrafish hearts. (A-A') DMSO-treated larvae showing TP1:VenusPEST positive cardiomyocytes (A and A', asterisks), endocardial cells (A and A', white arrows) and AV valve cells (A and A', yellow arrows). (B- C'') Embryos were treated starting at 48 hpf with 50 μM DAPT (B-B') or 10 μM LY411575 (C-C') and imaged at 81 hpf. In both sets of experimental animals, Notch activation was not observed in cardiomyocytes (B' and C', asterisks). (D) Number of apical constrictions after 50 μM DAPT or 10 μM LY411575 inhibitor treatments at 79 hpf. Each dot represents one heart. Data are shown as mean ± SEM. ns, no significant differences by Student's t-test. V, ventricle; AVC, atrioventricular canal. Scale bars, 20 μm. |
|
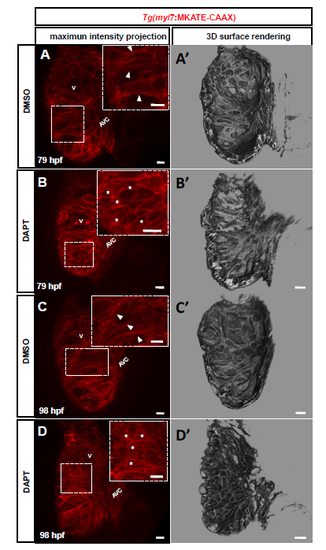
DAPT-treated hearts form disorganized trabecular ridges (A-D') 3D spinning disk images and surface renderings at mid-sagittal plane of 79 (A-B) and 98 (C-D) hpf Tg(myl7:MKATE-CAAX) zebrafish hearts. Dashed boxes show higher magnification images. DMSO-treated larvae show a smooth cardiac wall and clear trabecular ridges in the cardiac lumen at 79 (A and A', arrowheads) and 98 (C and C', arrowheads) hpf, while larvae treated with 100 μM DAPT starting at 48 hpf show a collapsed cardiac wall and disorganized trabecular structures at 79 (B and B', asterisks) and 98 (D and D', asterisks) hpf. V, ventricle; AVC, atrioventricular canal. Scale bars, 10 μm. |
|
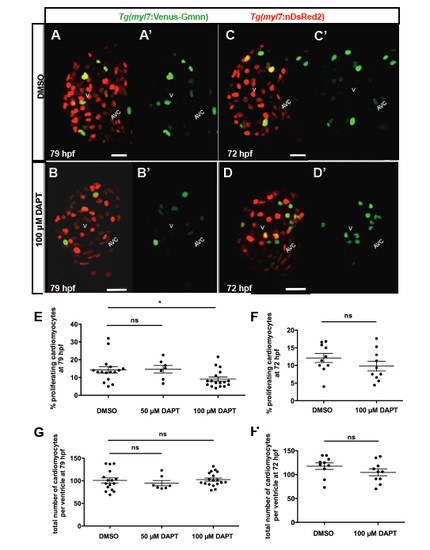
DAPT treatment does not affect cardiomyocyte proliferation during trabeculation (A-D') 3D spinning disk images at mid-sagittal plane of 79 (A-B') and 72 (C-D') hpf Tg(myl7:nDsRed2);Tg(myl7:mVenus-gmnn) zebrafish hearts. DMSO-treated larvae showing myl7:mVenus-gmnn positive cardiomyocytes at 79 (A-A') and 72 (C-C') hpf. Embryos treated with 100 μM DAPT starting at 48 and imaged at 79 (BB') hpf or starting at 60 and imaged at 72 (D-D') hpf showing myl7:mVenus-gmnn positive cardiomyocytes. (E, F) Graphs showing the percentage of proliferating cardiomyocytes after treating with 50 or 100 μM DAPT at 48 (E) or 100 μM DAPT at 60 (F) hpf. Each dot represents one heart. (G, H) Graphs showing the total number of cardiomyocytes per ventricle after treating with 50 or 100 μM DAPT at 48 (G) or 100 μM DAPT at 60 (H) hpf. Each dot represents one heart. V, ventricle; AVC, atrioventricular canal. Scale bars, 20 μm. |

