
- Title
-
Ihha induces hybrid cartilage-bone cells during zebrafish jawbone regeneration
- Authors
- Paul, S., Schindler, S., Giovannone, D., de Millo Terrazzani, A., Mariani, F.V., Crump, J.G.
- Source
- Full text @ Development
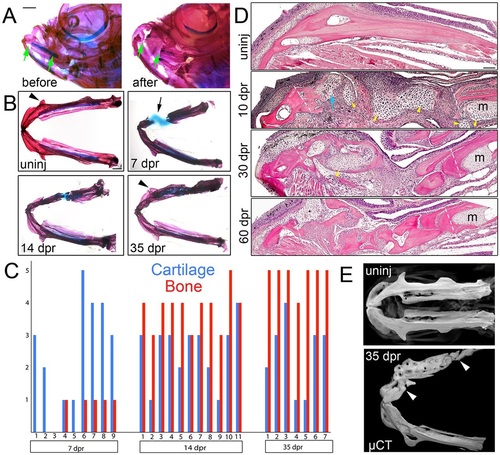
Regeneration of the lower jawbone in adult zebrafish. (A) Whole-mount views of adult zebrafish heads before and after resection stained with Alizarin Red and Alcian Blue to label bone and cartilage. Arrows show resection sites. (B) Dissected lower jaws show the time course of cartilage and bone formation during regeneration. Arrow denotes the repair cartilage that has contracted somewhat during mounting. Arrowheads indicate regeneration of the anguloarticular prominence. (C) Qualitative assessment of cartilage and bone formation during lower jaw regeneration in individual animals. The y-axis shows the amount of cartilage/bone in the lesion from none (0) to full spanning (5). (D) H&E staining on sections of the lower jawbone before and after resection. An extensive cartilage callus (yellow arrowheads) is seen at 10dpr, including at the anterior cut site (blue arrow) devoid of Meckel′s cartilage (m). Dashed lines show resection sites. (E) Bone µCT images show ventral views of lower jawbones from un-injured (uninj) and regenerated animals. Arrowheads indicate resection sites. See also Movie 1. Scale bars: 1mm in A,B and 100µm in D. |
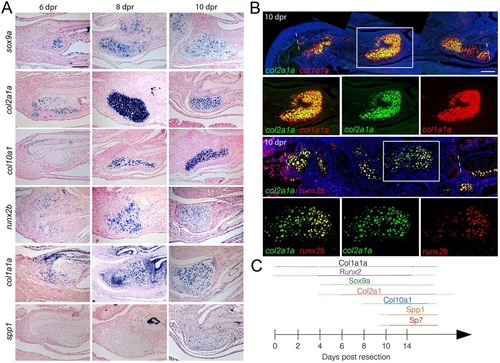
Co-expression of chondrocyte and osteoblast genes in repair cartilage. (A) Colorimetric in situ hybridization shows gene expression in the cartilage callus anterior to the cut site of the lower jawbone. The chondrocyte markers sox9a and col2a1a are seen in the cartilage callus by 6dpr, with a peak of expression at 8dpr. Expression of the hypertrophic chondrocyte marker col10a1 begins at 8dpr. The osteoblast markers runx2b and col1a1a are expressed in mesenchyme and early cartilage at 6dpr and beyond. By 10dpr, expression of the osteoblast marker spp1 is evident in the cartilage callus. (B) Two-color fluorescent in situ hybridization shows co-expression of col2a1a with col1a1a or runx2b at 10dpr. Dashed lines show resection sites and magnified regions (white boxes) demonstrate that individual cells co-express both markers. Hoechst labels nuclei in blue. (C) Summary of the time course of expression within the cartilage callus. Scale bars: 100µm. |
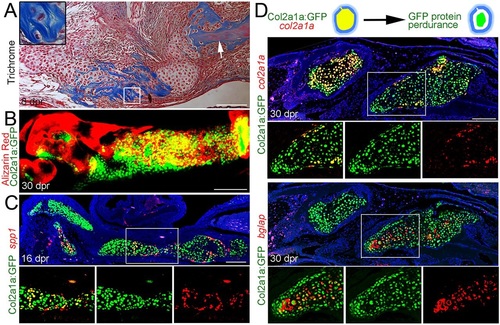
Mineralization and osteoblastic maturation of repair chondrocytes. (A) Trichrome staining at 8dpr reveals the presence of collagen-rich osteoid-like material surrounding individual chondrocytes of the regenerating jaw. Inset shows a magnified view of several chondrocytes. Note the similar appearance of collagen staining (blue) between the unresected jawbone (arrow) and the mineralizing cartilage. (B) Alizarin Red staining of the regenerating jawbone in live adult zebrafish shows mineralization of col2a1aBAC:GFP-expressing chondrocytes. (C) Fluorescent in situ hybridization together with anti-GFP immunohistochemistry shows a subset of col2a1aBAC:GFP+ chondrocytes co-expressing the osteoblast marker spp1. (D) Schematic showing that GFP protein perdures in cells long after endogenous col2a1a mRNA ceases to be produced. In the fluorescent in situ images of regenerating jawbone at 30dpr, cells of the left callus still express col2a1a whereas cells of the right callus have largely ceased col2a1a expression and now express high levels of bglap (osteocalcin). Retention of GFP protein shows that bglap+ cells arise from cells that previously expressed col2a1aBAC:GFP. Areas in the white boxes are magnified and presented as merged and individual channels. Scale bars: 100µm. |
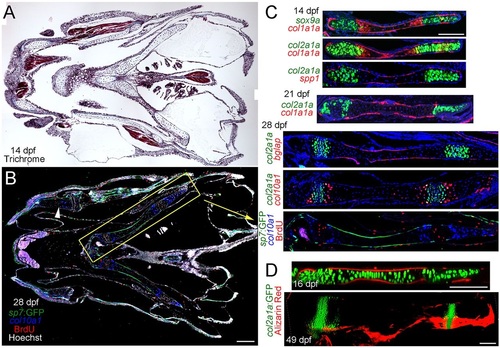
Development of growth plates in juvenile zebrafish. (A) Trichrome staining of a coronal section through the juvenile fish jaw. (B) Coronal section of a 28dpf juvenile jaw shows osteoblast precursors labeled by sp7:GFP, col10a1-expressing hypertrophic chondrocytes and BrdU+ proliferating cells. Hoechst labels nuclei in white. The ceratohyal cartilage (yellow box) displays a mammalian-like growth plate architecture. BrdU+ and col10a1-expressing zones are also observed in other cartilages, e.g. Meckel′s (arrowhead). (C) Double fluorescent in situ hybridization at 14dpf shows sox9a or col2a1a expression (green) in growth plate chondrocytes at either end of the ceratohyal cartilage and col1a1a expression (red) in the periosteum and a subset of chondrocytes at the hypertrophic borders. spp1 expression (red) is confined to the periosteum. At 21dpf, col2a1a continues to be expressed in two zones of chondrocytes and col1a1a is now largely confined to the periosteum. At 28dpf, bglap is expressed exclusively in the periosteum, and col10a1 is expressed in two stripes of hypertrophic chondrocytes surrounding each zone of col2a1a+ chondrocytes. A comparison of col2a1a expression with BrdU reactivity shows that col2a1a labels proliferating chondrocytes. (D) At 16dpr, mineralization labeled by Alizarin Red occurs exclusively within the periosteum. By 49dpf, two growth zones of col2a1aBAC:GFP+ chondrocytes persist, yet Alizarin Red+ mineralization remains confined to a layer covering the ceratohyal cartilage. Scale bars: 100µm. |
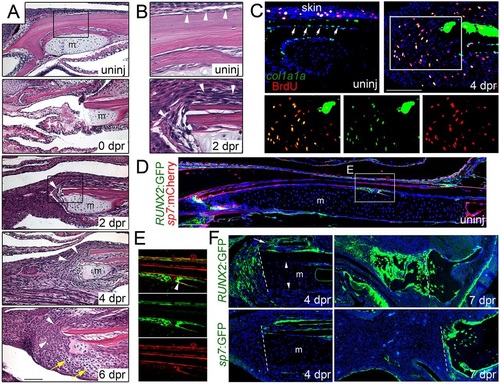
Mobilization of the periosteum in response to jaw resection. (A,B) H&E staining shows the posterior site of jaw resection before and during the first week of regeneration. In the uninjured animal, the lower jawbone is lined by a thin layer of periosteum (arrowheads, see inset B). Immediately after resection (0dpr), a small portion of Meckel′s cartilage (m) remains and soft tissue collapses into the section. By 2dpr, the periosteum (arrowheads) thickens and covers the cut surface of the bone (see inset B). The periosteum continues to expand into the resected region by 4dpr, and 2 days later, mesenchymal cells are seen throughout the resected area and early chondrocytes can be distinguished (yellow arrows). (C) Fluorescent in situ hybridization for col1a1a (green) combined with BrdU staining (red) shows col1a1a+ cells lining the uninjured jawbone periosteum (arrows), as well as the skin. At 4dpr, col1a1a expression increases in the periosteum and many col1a1a+ cells are seen in the mesenchyme within the resection zone. While col1a1a+ cells within the uninjured periosteum are largely negative for BrdU (in contrast to those within the skin), many BrdU+, col1a1a+ cells are seen in the mesenchyme near the resection site (see insets for magnified images, merged and single channels). (D) Section of an uninjured adult jaw shows sp7:mCherry (detected by anti-mCherry antibody) in osteoblasts lining bone and RUNX2:GFP (detected by anti-GFP antibody) in sparse patches of periosteum. (E) Magnification of boxed region in D shows RUNX2:GFP expression in periosteal cells underneath sp7:mCherry+ osteoblasts. A few cells co-express both transgenes (arrowhead), consistent with early differentiating osteoblasts. (F) After resection, RUNX2:GFP+ cells are found in the periosteum (arrow) overlying the jawbone and in expanding mesenchyme at 4dpr, but not in Meckel′s cartilage or its associated periochondrium (arrowheads). By 7dpr, both mesenchymal and early chondrocytes express RUNX2:GFP. By contrast, sp7:GFP labels the periosteum but not mesenchymal cells or chondrocytes at 4 and 7dpr. Hoechst labels nuclei in blue. Dashed lines indicate resection sites. Scale bars: 100µm. |
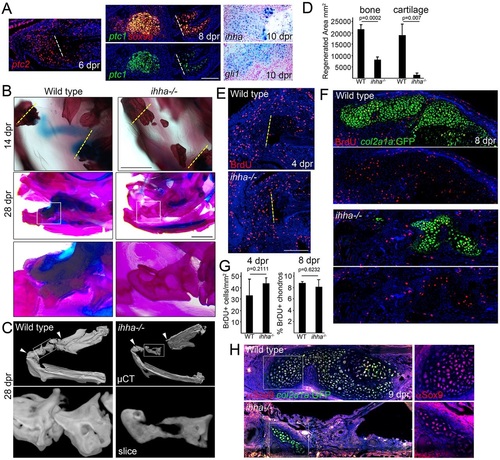
Requirement of ihha in the generation of repair cartilage. (A) In situ hybridization of the regenerating jawbone shows mesenchymal expression of ptc2 at 6dpr, co-expression of sox9a and ptc1 in the cartilage callus at 8dpr, and ihha and gli1 in the callus at 10dpr. Dashed lines show resection sites. (B) Compared with size-matched wild-type siblings, ihha-/- adults show a lack of cartilage at 14dpr. Whereas the wild type bridges the resection site with thick bone by 28dpr, ihha-/- mutants have reduced and hollow bone. (C) Bone µCT shows reduced mineralization within the repair region (arrowheads). Top images are ventral views of the lower jaw and boxes show magnified images below. See also Movies 2 and 3. (D) Quantification of the area of repair bone and cartilage in the wild type and ihha mutants at 28dpr. A Student′s t-test showed statistical differences between groups. Standard errors of the mean are shown. (E) ihha mutants and their wild-type siblings have similar numbers of BrdU+ cells in the resected regions (left of the dashed lines). (F) BrdU incorporation (red) and col2a1aBAC:GFP labeling of chondrocytes (green, detected by anti-GFP antibody) shows reduced cartilage but similar proliferation rates in ihha mutants. (G) Quantification of labeled BrdU+ nuclei in wild type and mutants. A Student′s t-test showed no statistical differences at either stage. (H) Antibody staining in wild type and ihha mutants carrying the col2a1aBAC:GFP transgene shows fewer chondrocytes expressing Sox9 (red) and GFP (green) in mutants versus siblings. Insets show that the few cartilage cells that form in mutants express Sox9 protein. Hoechst labels nuclei in blue. Scale bars: 1mm in B and 100µm in A,E. |
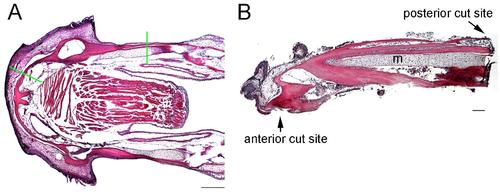
Extent of lower jaw resections. (A) Coronal section of un-resected adult lower jaw stained with H&E. Green lines show where resection cuts are made. Anterior is to the left. (B) Histological section through the tissue that was removed showing the extent of bone removed and complete removal of the distal end of Meckel’s cartilage (m). Scale bars: A, 1 mm; B, 100 microns. |
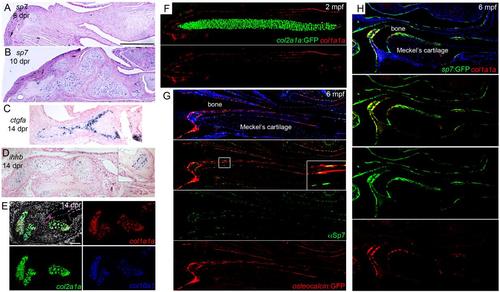
Gene expression in the cartilage callus and adult jaw. (A-D) Colorimetric RNA in situ hybridization shows gene expression in the cartilage callus. The expression of sp7 is not yet visible in the mesenchyme at 6 dpr and evident in the cartilage callus by 10 dpr. At 14 dpr, ctgfa is expressed in a subset of chondrocytes within the callus. Also at 14 dpr, ihhb is expressed weakly in some repair chondrocytes; inset shows stronger expression in the remnant growth plate of the ceratohyal cartilage. (E) Three-color fluorescent in situ hybridization shows co-expression of col1a1a (red), col2a1a (green), and col10a1 (blue) within repair chondrocytes at 10 dpr. Note the similar level of expression of col1a1a in the bone (top right). Nuclei are detected with Hoechst (white). (F) Transgenic col2a1aBAC:GFP fish have distinct and non-overlapping expression of GFP in Meckel′s cartilage and col1a1a in periosteum at 2 mpf. (G) A subset of Sp7+ cells (green, detected by anti-Sp7 antibody) also express an osteocalcin:GFP transgene (red, detected by anti-GFP antibody). Inset corresponds to boxed region and shows both Sp7-only cells and Sp7+/osteocalcin:GFP+ cells. Note nuclear Sp7 localization compared to cytoplasmic and nuclear GFP. (H) A subset of sp7:GFP+ cells express col1a1a. Scale bars = 100 microns. |
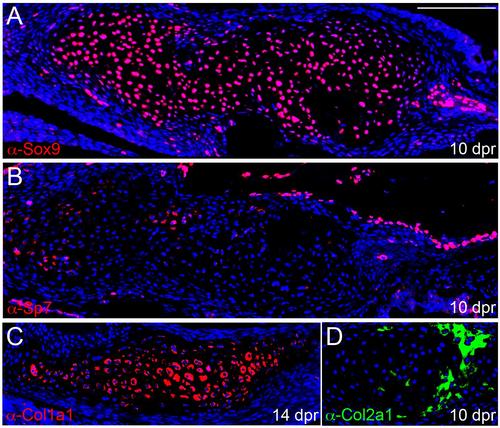
Protein expression in the cartilage callus. (A-D) Immunofluorescent assays on sections show protein expression of Sox9, Sp7, Col1a1, and Col2a1 within the cartilage callus. Nuclei are labeled with Hoechst (blue). Scale bar = 100 microns. |
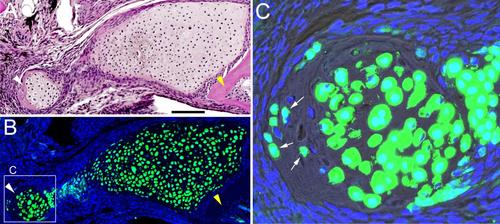
Contribution of col2a1aBAC:GFP-derived cells to bone. (A) H&E staining at 30 dpr shows remnant cartilage surrounded by bone (white arrowhead) which has a similar appearance to bone on the right (yellow arrowhead). (B) An adjacent section from this col2a1aBAC:GFP animal was processed for anti-GFP staining (green). Hoescht labels nuclei in blue. (C) Magnification shows that GFP+ cells are embedded in bone (arrows). A Normarski channel is included to show bone matrix. Scale bar = 100 microns. |
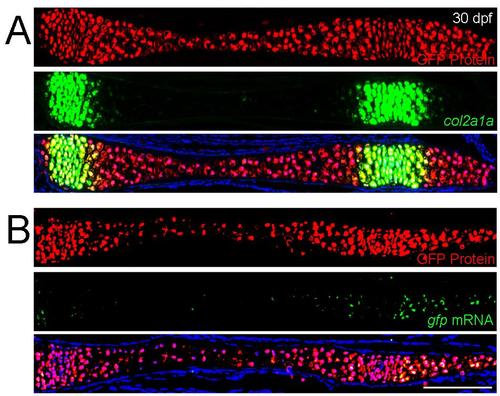
Perdurance of GFP in developing cartilage. (A and B) Sections of the ceratohyal cartilage in 30 dpf col2a1aBAC:GFP juvenile zebrafish. Anti-GFP staining (red) compared to endogenous col2a1a RNA (green, A) or GFP RNA (green, B) shows that cells retain GFP protein after they shut down expression of col2a1a or GFP message. Scale bar = 100 microns. |