
- Title
-
Tip cell-specific requirement for an atypical Gpr124- and Reck-dependent Wnt/β-catenin pathway during brain angiogenesis
- Authors
- Vanhollebeke, B., Stone, O.A., Bostaille, N., Cho, C., Zhou, Y., Maquet, E., Gauquier, A., Cabochette, P., Fukuhara, S., Mochizuki, N., Nathans, J., Stainier, D.Y.
- Source
- Full text @ Elife
CNS vascular defects in gpr124 mutants. (A) Schematic representation of Gpr124 structure and TALEN target site locations corresponding to gpr124s984 and gpr124s985 alleles. LRR: leucine-rich repeats; LRRCT: leucine-rich repeat C-terminal domain; Ig: Ig-like domain; HBD: hormone binding domain; GAIN: GPCR-autoproteolysis inducing domain; GPS: GPCR proteolysis site; PBD: PDZ binding domain. (B) Lateral views of wild-type, gpr124s984/s984 and gpr124s985/s985 larvae at 5 dpf. (C) Lateral views of wild-type, gpr124s984/s984 and gpr124s985/s985 Tg(kdrl:GFP) embryos at 36 hpf (hindbrain region, upper panels) and 24 hpf (trunk region, bottom panels). MCeV: middle cerebral vein. Scale bar, 50 µm. (D) Maximal intensity projection of a confocal z-stack of the cranial vasculature of Tg(kdrl:GFP) wild-type and gpr124s984/s984 embryos at 60 hpf in dorsal views (anterior to the left) and wire diagram of the brain vasculature in lateral (middle panels) and dorso-lateral (bottom panels) views. Red vessels in the 3D renderings represent the intra-cerebral central arteries (CtAs), blue vessels represent the extra-cerebral connections between the PHBC and BA lining the hindbrain ventrally, and gray vessels represent the perineural vessels (PHBC, PMBC, BA, and PCS) to which the central arteries connect in wild-type embryos. Scale bar, 100 µm. (E) Quantification of hindbrain CtAs upon Gpr124 depletion in 60 hpf embryos. (F) Quantification of hindbrain CtAs in control and gpr124 morphants at 60 hpf after injection at the one-cell stage of 100 pg RNA encoding the depicted receptors or Gpr124/Gpr125 hybrid receptors. (G) Vasculature of wild-type and gpr124 mutant adults. Single plane confocal image of the vascular network (upper panels: scale bar, 100 µm) and immunostaining for Slc2a1 and Pgp in sections through the optic tectum (middle panels: scale bars, 20 µm). Evaluation of the optic tectum and liver vessel permeability by fluorescent streptavidin labelling (red signal) 60 min after intracardial injection of sulfo-NHS-biotin in live animals (bottom panels; scale bar, 20 µm). In all panels, values represent means ± SD (*p < 0.05; **p < 0.01; Kruskal–Wallis test). Morpholino and RNA injections were performed as described in ‘Methods’. |
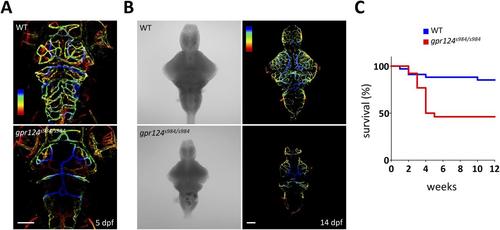
Generation of gpr124 mutant zebrafish. (A) Maximal intensity projection of a confocal z-stack of Tg(kdrl:GFP) wild-type and gpr124s984/s984 cranial vasculature at 5 dpf in dorsal views color-coded by depth. Dorsal most vessels are blue, ventral most vessels are red. Scale bar, 100 µm. (B) DIC images (left panel) and maximal intensity projection of a confocal z-stack of Tg(kdrl:GFP) wild-type and gpr124s984/s984 cranial vasculature at 14 dpf in dorsal views color-coded by depth (right panels). Dorsal most vessels are blue, ventral most vessels are red. Scale bar, 100 µm. (C) Survival curves of wild-type and gpr124s984/s984 mutants. The survival of respectively 34 and 26 animals was recorded. |
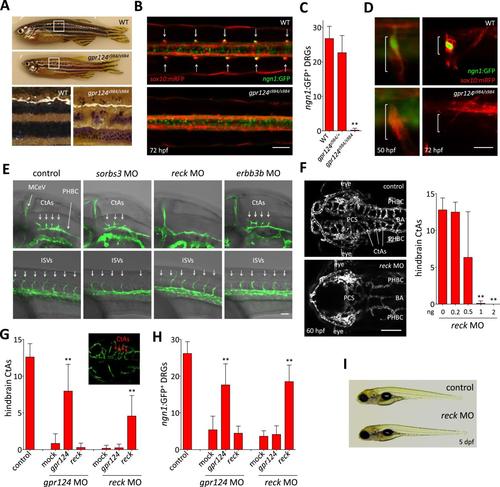
Essential regulation of CNS angiogenesis by Reck. (A) Lateral views of skin pigmentation patterns of wild-type and gpr124s984/s984 adults. Bottom panels are high magnification images of the upper panel boxed areas. (B) Dorsal views of DRGs in the trunk region of wild-type and gpr124s984/s984 Tg(ngn1:GFP); Tg(sox10:mRPF) larvae at 72 hpf; arrows point to DRGs (anterior to the left). Scale bar, 50 µm. (C) Quantification of ngn1:GFP+ DRGs in 72 hpf wild-type, gpr124s984/+ and gpr124s984/s984 larvae. ngn1:GFP+ DRGs were counted on one side of the larvae. (D) Lateral views of DRG in Tg(ngn1:GFP);Tg(sox10:mRPF) wild-type and gpr124s984/s984 animals. Scale bar, 20 µm. (E) Lateral views (anterior to the left) of Tg(kdrl:GFP) control and morphant embryos at 36 hpf (hindbrain region, upper panels) and 24 hpf (trunk region, bottom panels). Arrows point to the forming CtAs (upper panels) and ISVs (lower panels). Scale bar, 50 µm. (F) Maximal intensity projection of a confocal z-stack of Tg(kdrl:GFP) wild-type and reck morphant cranial vasculature at 60 hpf in dorsal views (anterior to the left; scale bar, 100 µm) and quantification of hindbrain CtAs after Reck downregulation by anti-sense morpholino injections at various doses. (G) Quantification of hindbrain CtAs in control and gpr124 or reck morphants at 60 hpf after injection at the one-cell stage of 100 pg RNA encoding Gpr124 or Reck. The insert shows a typical rescue. (H) Quantification of ngn1:GFP+ DRGs in control and gpr124 or reck morphants at 72 hpf after injection at the one-cell stage of 200 pg RNA encoding Gpr124 or Reck. ngn1:GFP+ DRGs were counted on one side of the larvae. (I) Lateral view of wild-type and reck morphants at 5 dpf. In all panels, values represent means ± SD (*p < 0.05; **p < 0.01; Kruskal–Wallis test). Morpholino and RNA injections were performed as described in ‘Methods’. EXPRESSION / LABELING:
|
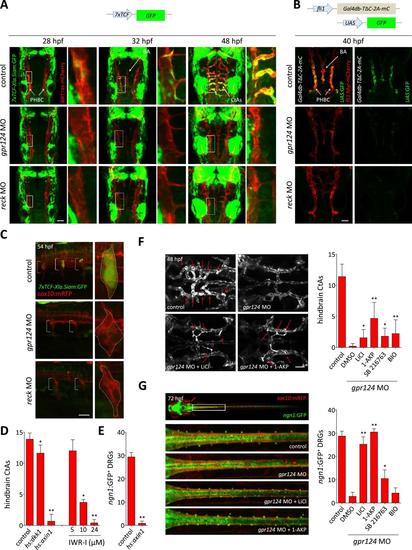
Wnt/β-catenin signaling is controlled by Gpr124 and Reck. (A) Maximal intensity projection of a confocal z-stack of Tg(7xTCF-Xia.Siam:GFP) Wnt/β-catenin reporter expression during brain vascular development in wild-type, gpr124 or reck morphant Tg(kdrl:ras-mCherry) embryos. (B) Activity of the endothelial-specific Wnt/β-catenin reporter in the PHBC and BA in wild-type, gpr124 or reck morphant Tg(fli1:Myr-mcherry) embryos at 40 hpf. (C) Lateral view of Tg(7xTCF-Xia.Siam:GFP) Wnt/β-catenin reporter expression at 54 hpf in the trunk region of wild-type, gpr124 or reck morphant Tg(sox10:mRPF) embryos (anterior to the left). (D) Quantification of hindbrain CtAs at 60 hpf after genetic and pharmacological inhibition of Wnt/β-catenin signaling. Heat-shock and pharmacological inhibition were performed as described in ‘Methods’. (E) Quantification of ngn1:GFP+ DRGs at 72 hpf after genetic inhibition of Wnt/β-catenin signaling. ngn1:GFP+ DRGs were counted on one side of the larvae. (F) Maximal intensity projection of a confocal z-stack of the cranial vasculature and quantification of hindbrain CtAs in control or gpr124 morphant Tg(kdrl:EGFP) embryos after exposure to the indicated GSK-3β inhibitors from the 16-somite stage onwards. Red arrows point to CtAs. Pharmacological inhibitions were performed as described in ‘Methods’. (G) Dorsal views and quantification of DRGs in control or gpr124 morphant Tg(ngn1:GFP);Tg(sox10:mRPF) embryos after exposure to the indicated GSK-3β inhibitors from the 16-somite stage onwards. ngn1:GFP+ DRGs were counted on one side of the larvae. Pharmacological inhibitions were performed as described in ‘Methods’. Scale bars, 50 µm. In all panels, values represent means ± SD (*p < 0.05; **p < 0.01; Kruskal–Wallis test: (D), (F), and (G); Mann–Whitney test: (E)). EXPRESSION / LABELING:
PHENOTYPE:
|
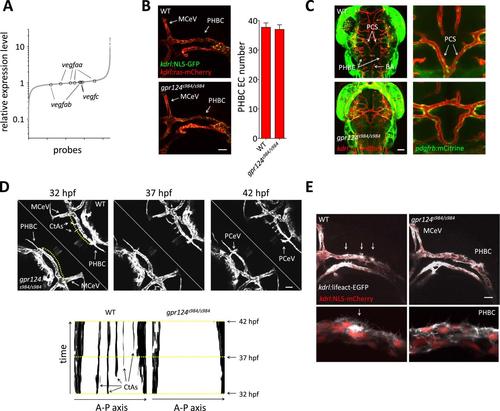
Tip cell defects in Wnt/β-catenin-deficient PHBCs. (A) Scatterplot of a microarray comparison of wild-type and gpr124s984/s984 embryos at 48 hpf. Each dot refers to the relative signal intensity of a given probe in mutant vs wild-type embryos. Circles identify independent probes for vegfaa, vegfab, and vegfc. (B) Endothelial cell number in the PHBCs of wild-type and gpr124s984/s984 embryos at 30 hpf. kdrl:NLS-GFP+ nuclei were counted on one side of the embryos. (C) Dorsal views of Tg(pdgfrb:mCitrine);Tg(kdrl:ras-mCherry) wild-type and gpr124s984/s984 embryos at 40 hpf. (D) Stills from Video 3 recording sprouting angiogenesis in the hindbrain of Tg(kdrl:GFP) wild-type and gpr124s984/s984 embryos. Below are kymograph plots showing a time course of pixel intensity across the yellow virtual lines running 15 µm dorsal to the PHBC (from the anterior MCeV to the posterior PCeV [posterior cerebral vein]) and depicted in the upper left panel. (E) Lateral views of Tg(kdrl:lifeact-GFP);Tg(kdrl:NLS-mCherry) wild-type and gpr124s984/s984 hindbrains at 30 hpf. Arrows point to actin-dense structures forming in the PHBC vessel wall. Scale bars, 50 µm. Values represent means ± SD. EXPRESSION / LABELING:
|
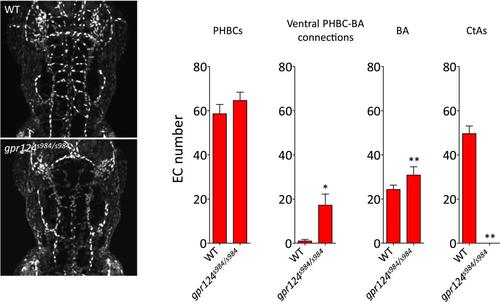
Endothelial cell number in wild-type and gpr124s984/s984 brain vessels at 54 hpf. Maximal intensity projection of a confocal z-stack of the Tg(kdrl:NLS-GFP) wild-type and gpr124s984/s984 cranial vasculature at 54 hpf (left panels). kdrl:NLS-GFP+ EC nuclei were counted in the PHBCs, ventral PHBC-BA connections, BA and CtAs (right panels). In all panels, values represent means ± SD (*p < 0.05; **p < 0.01; Mann–Whitney test) of a minimal of five embryos. |
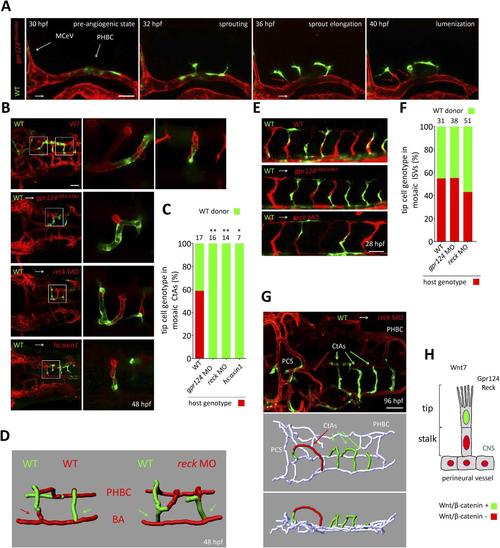
Tip cell-specific requirement for Gpr124 and Reck-controlled Wnt/β-catenin signaling. (A) Stills from Video 8 recording sprouting angiogenesis from a mosaic PHBC obtained by blastula-stage transplantation. Green kdrl:GFP+ endothelial cells derive from a wild-type donor embryo, red kdrl:ras-mCherry+ endothelial cells are from the gpr124s984/s984 host. (B) Dorsal views of 48 hpf mosaic cranial vasculatures of the indicated genotypes. Right panels are high magnification views of a confocal z-stack of relevant depth illustrating intra-cerebral mosaic CtAs corresponding to the boxed areas in the left panels. (C) Contribution of cells of defined genotype to the tip cell position of mosaic CtAs after transplantation of wild-type Tg(kdrl:GFP) donor cells (green) into Tg(kdrl:ras-mCherry) host blastulae of the indicated genotype (red). Number of mosaic vessels analyzed is indicated above each bar. (D) 3D Imaris (Bitplane) reconstruction of representative hindbrain mosaic vascular networks. Arrows point to the cells connecting with the BA, after leading the CtA as tip cells. (E) Lateral views of the trunk region after transplantation of Tg(kdrl:GFP) wild-type donor cells into Tg(kdrl:ras-mCherry) host blastulae of the indicated genotype. (F) Contribution of cells of defined genotype to the tip cell position of mosaic ISVs after transplantation of wild-type Tg(kdrl:GFP) donor cells (green) into Tg(kdrl:ras-mCherry) host blastulae of the indicated genotype (red). Number of mosaic vessels analyzed is indicated above each bar. (G) Dorsal view of the cranial vasculature and 3D Imaris (Bitplane) reconstruction of the brain vessels of a 96 hpf mosaic larva after transplantation of wild-type Tg(kdrl:GFP) donor cells into reck morphant Tg(kdrl:ras-mCherry) host blastula. (H) Cellular requirement for Wnt/β-catenin, Gpr124, and Reck during sprouting angiogenesis in the zebrafish CNS (*p < 0.05; **p < 0.01; exact Fisher test). |
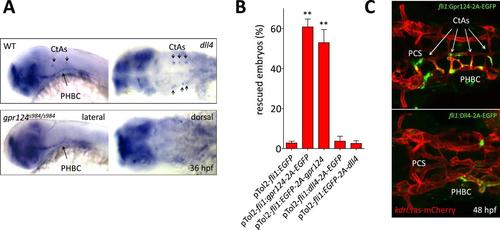
Transgenic endothelial dll4 expression is not sufficient to rescue the gpr124 mutant vascular defects. (A) dll4 whole-mount in situ hybridization in wild-type and gpr124 mutant embryos at 36 hpf. (B) Quantification of the proportion of gpr124 morphant embryos with one or more central arteries at 60 hpf. Embryos were co-injected with gpr124 MO, tol2 transposase mRNA and pTol2-fli1:egfp, pTol2-fli1:gpr124-2A-EGFP, pTol2-fli1:EGFP-2A-gpr124, pTol2-fli1:dll4-2A-EGFP or pTol2-fli1:EGFP-2A-dll4 (C) Maximal intensity projection of a confocal z-stack of the cranial vasculature of Tg(kdrl:ras-mCherry) gpr124 morphant embryos at 60 hpf in dorsal views (anterior to the left) after transgenic endothelial overexpression (green fluorescence) of Gpr124-2A-EGFP (upper panel) or Dll4-2A-EGFP (bottom panel). Values represent means ± SD (*p < 0.05; **p < 0.01; one-way ANOVA test). |