|
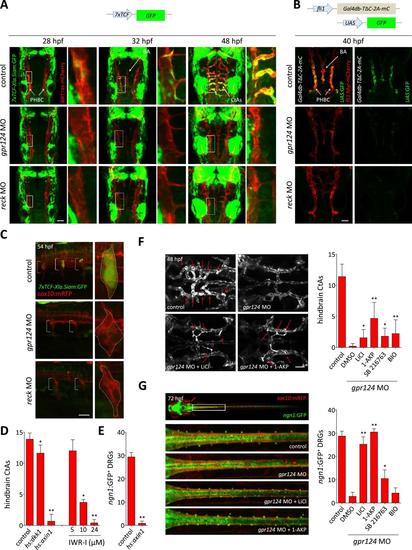
Wnt/β-catenin signaling is controlled by Gpr124 and Reck. (A) Maximal intensity projection of a confocal z-stack of Tg(7xTCF-Xia.Siam:GFP) Wnt/β-catenin reporter expression during brain vascular development in wild-type, gpr124 or reck morphant Tg(kdrl:ras-mCherry) embryos. (B) Activity of the endothelial-specific Wnt/β-catenin reporter in the PHBC and BA in wild-type, gpr124 or reck morphant Tg(fli1:Myr-mcherry) embryos at 40 hpf. (C) Lateral view of Tg(7xTCF-Xia.Siam:GFP) Wnt/β-catenin reporter expression at 54 hpf in the trunk region of wild-type, gpr124 or reck morphant Tg(sox10:mRPF) embryos (anterior to the left). (D) Quantification of hindbrain CtAs at 60 hpf after genetic and pharmacological inhibition of Wnt/β-catenin signaling. Heat-shock and pharmacological inhibition were performed as described in ‘Methods’. (E) Quantification of ngn1:GFP+ DRGs at 72 hpf after genetic inhibition of Wnt/β-catenin signaling. ngn1:GFP+ DRGs were counted on one side of the larvae. (F) Maximal intensity projection of a confocal z-stack of the cranial vasculature and quantification of hindbrain CtAs in control or gpr124 morphant Tg(kdrl:EGFP) embryos after exposure to the indicated GSK-3β inhibitors from the 16-somite stage onwards. Red arrows point to CtAs. Pharmacological inhibitions were performed as described in ‘Methods’. (G) Dorsal views and quantification of DRGs in control or gpr124 morphant Tg(ngn1:GFP);Tg(sox10:mRPF) embryos after exposure to the indicated GSK-3β inhibitors from the 16-somite stage onwards. ngn1:GFP+ DRGs were counted on one side of the larvae. Pharmacological inhibitions were performed as described in ‘Methods’. Scale bars, 50 µm. In all panels, values represent means ± SD (*p < 0.05; **p < 0.01; Kruskal–Wallis test: (D), (F), and (G); Mann–Whitney test: (E)).
|