
Fig. 6
- ID
- ZDB-FIG-150811-33
- Publication
- Vanhollebeke et al., 2015 - Tip cell-specific requirement for an atypical Gpr124- and Reck-dependent Wnt/β-catenin pathway during brain angiogenesis
- Other Figures
- All Figure Page
- Back to All Figure Page
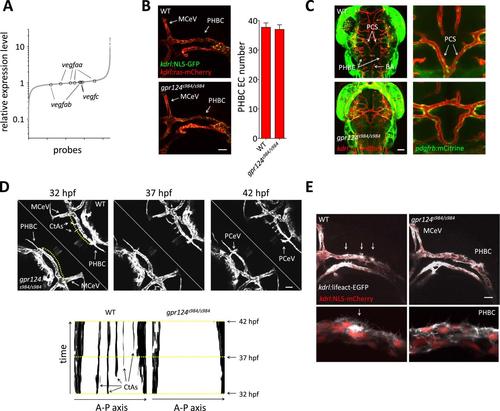
Tip cell defects in Wnt/β-catenin-deficient PHBCs. (A) Scatterplot of a microarray comparison of wild-type and gpr124s984/s984 embryos at 48 hpf. Each dot refers to the relative signal intensity of a given probe in mutant vs wild-type embryos. Circles identify independent probes for vegfaa, vegfab, and vegfc. (B) Endothelial cell number in the PHBCs of wild-type and gpr124s984/s984 embryos at 30 hpf. kdrl:NLS-GFP+ nuclei were counted on one side of the embryos. (C) Dorsal views of Tg(pdgfrb:mCitrine);Tg(kdrl:ras-mCherry) wild-type and gpr124s984/s984 embryos at 40 hpf. (D) Stills from Video 3 recording sprouting angiogenesis in the hindbrain of Tg(kdrl:GFP) wild-type and gpr124s984/s984 embryos. Below are kymograph plots showing a time course of pixel intensity across the yellow virtual lines running 15 µm dorsal to the PHBC (from the anterior MCeV to the posterior PCeV [posterior cerebral vein]) and depicted in the upper left panel. (E) Lateral views of Tg(kdrl:lifeact-GFP);Tg(kdrl:NLS-mCherry) wild-type and gpr124s984/s984 hindbrains at 30 hpf. Arrows point to actin-dense structures forming in the PHBC vessel wall. Scale bars, 50 µm. Values represent means ± SD. |
| Fish: | |
|---|---|
| Observed In: | |
| Stage Range: | Prim-15 to High-pec |