
- Title
-
Epigenetic control of intestinal barrier function and inflammation in zebrafish
- Authors
- Marjoram, L., Alvers, A., Deerhake, M.E., Bagwell, J., Mankiewicz, J., Cocchiaro, J.L., Beerman, R.W., Willer, J., Sumigray, K.D., Katsanis, N., Tobin, D.M., Rawls, J.F., Goll, M.G., Bagnat, M.
- Source
- Full text @ Proc. Natl. Acad. Sci. USA
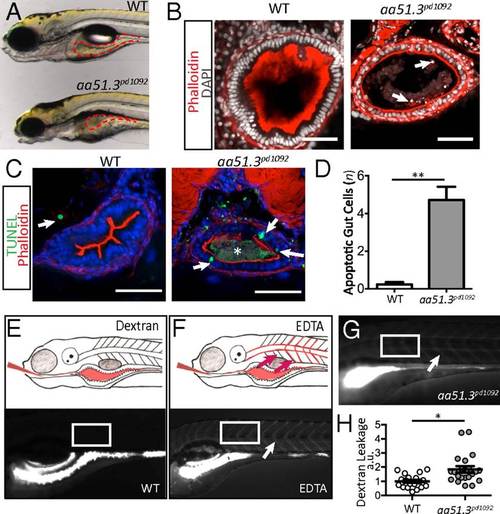
aa51.3pd1092 mutants have an IBD-like phenotype. A mutant with excessive intestinal cell shedding and apoptosis and perturbed epithelial morphology was isolated from a forward genetic screen. (A) WT (Upper) and aa51.3pd1092 mutant (Lower) larvae at 120 hpf. (B) Confocal images of WT and aa51.3pd1092 cross-sections. Arrows point to shed cells in the mutant. (C) Confocal images of cross-sections. TUNEL+ cells (green; arrows) in 120 hpf WT and aa51.3pd1092 larvae. Asterisk marks luminal debris. (D) Apoptotic cells in the anterior gut epithelium (n = 13 WT; n = 18 mutants). (E) Schematic of dextran gavage (Upper) and image of 120 hpf WT larva 30 min after gavage (4,000 MW dextran; Lower). (F) Schematic of barrier perturbation after EDTA + dextran cogavage (Upper) and image of 120 hpf WT larva 30 min after gavage (Lower). (G) Dextran gavage in aa51.3pd1092 mutants. Arrow marks extra extraintestinal dextran (F and G). White box indicates region of interest (ROI) measurement (E–G). (H) Quantification of dextran leakage as measured by fluorescence intensity (measured in arbitrary units, a.u.) in WT and mutant larvae after 30 min (n = 19 WT; n = 21 mutants). Mutants show a significant barrier defect. (Scale bars: 50 µm.) Bars represent mean ± SEM. *P < 0.0001, **P < 0.01. Show Less PHENOTYPE:
|
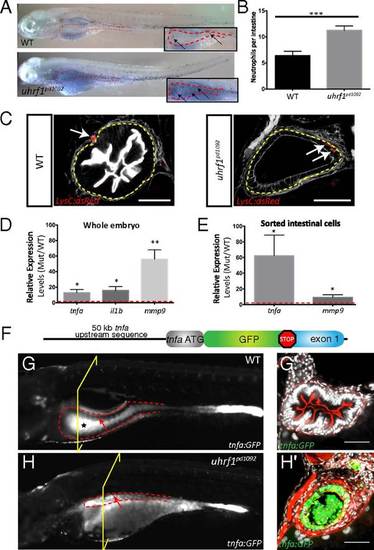
Intestinal inflammation in uhrf1pd1092 mutants. Increased neutrophil recruitment, neutrophil infiltration into the intestinal epithelium, and elevated proinflammatory cytokine expression is observed in the intestine of uhrf1pd1092 mutants. (A) Whole-mount images of WT (Upper) and mutant (Lower) 120 hpf larvae stained with sudan black to mark neutrophils. Insets show a higher magnification view of the intestine (red dotted line), and arrows point to individual neutrophils. (B) Quantification of neutrophils in the intestinal area in WT (black) and mutant (gray) larvae. (n = 21 WT; n = 25). (C) Confocal images of cross-sections showing neutrophil (red) localization in 120 hpf WT and uhrf1pd1092 mutant larvae expressing LysC:dsRed. White arrows indicate neutrophils, which have infiltrated into the intestinal epithelium (yellow dotted line) in mutants but are restricted to the mesenchyme of WT. (Scale bars: 50 µm.) (D) Relative expression (mutant/WT) of proinflammatory genes in whole larvae. All genes are significantly elevated in mutants compared with WT. (E) Relative expression (mutant/WT) of tnfa and mmp9 in sorted intestinal epithelial cells. tnfa is greatly up-regulated in the intestine of mutants. (F) TgBAC(tnfa:GFP) construction schematic. (G and G′) Whole-mount (G) and confocal image of cross-section (G′) of a 120 hpf WT TgBAC(tnfa:GFP) transgenic larvae. The black star in G highlights autofluorescence in the WT gut, whereas the arrow points to the anterior gut epithelium that is devoid of TgBAC(tnfa:GFP) expression. (H and H′) Whole-mount (H) and confocal image of cross-section (H′) of 120 hpf uhrf1pd1092 larva with TgBAC(tnfa:GFP) in intestinal epithelium. The arrow highlights elevated epithelial expression of TgBAC(tnfa:GFP) in the intestine. The yellow bracket indicates the plane of section for G2 and H2. *P < 0.05, **P < 0.01, ***P < 0.001. Show Less |
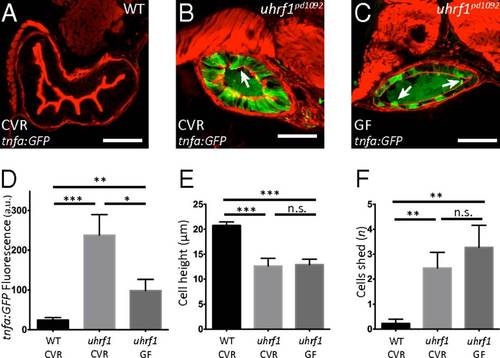
Microbiota presence enhances tnfa elevation in the uhrf1pd1092 gut epithelium but is not required for the development of an IBD-like phenotype. (A–C) Confocal images of cross-sections of conventionally raised (CVR) 120 hpf WT (A); CVR 120 hpf uhrf1pd1092 (B), and germ-free (GF) 120 hpf uhrf1pd1092 (C) larvae. The arrows in B and C mark cells being shed from the epithelium. (D) TgBAC(tnfa:GFP) fluorescence (measured in arbitrary units, a.u.) under CVR and GF conditions. (E) Cell height measurement under CVR and GF conditions. Cell height is unchanged between CVR and GF mutants. (F) Quantification of cell shedding. Cell shedding was not decreased in GF mutants. Phalloidin, red. (Scale bars: 50 µm.) (D–F: n = 13 WT CVR; n = 9 mutant CVR; n = 11 mutant GF). Bars represent mean ± SEM. Significant differences between the means were detected after an ANOVA. *P < 0.05, **P < 0.01, ***P < 0.0001, n.s., not significant. Show Less |
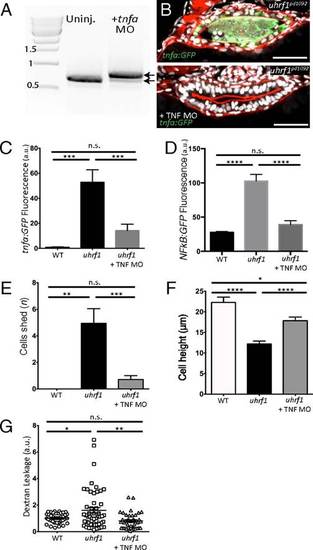
tnfa knockdown rescues the IBD-like phenotype in the uhrf1pd1092 gut. (A) RT-PCR for tnfa from 103 hpf larvae after injection of the tnfa splice-blocking morpholino. The morpholino resulted in the inclusion of the 112-bp intron between exons 1 and 2 (top arrow; bottom arrow marks endogenous product). (B) Confocal images of cross-sections of genotyped uhrf1pd1092 mutant (Upper) and tnfa morpholino-injected uhrf1pd1092 mutant (Lower) larvae at 103 hpf expressing TgBAC(tnfa:GFP). (C) TgBAC(tnfa:GFP) fluorescence quantification (measured in arbitrary units, a.u.) revealed a decrease in intestinal fluorescence of genotyped mutants after morpholino injection. (D) Tg(NFκB:EGFP) fluorescence quantification (measured in arbitrary units, a.u.). Intestinal fluorescence was decreased in genotyped mutants after morpholino injection. (E) Quantification of cell shedding: Cell shedding was decreased in genotyped morpholino-injected mutants. (F) Cell height measurement: Cell height was increased in genotyped morpholino-injected mutants. (G) Dextran leakage quantification. Improved barrier function was observed in morpholino-injected mutants. (C and E: n = 9, WT; n = 16, mutant; n = 21, mutant + morpholino; D: n = 14, WT; n = 7, mutant; n = 16, mutant + morpholino; F: n = 43, WT; n = 53, mutant; n = 40, mutant + morpholino) Phalloidin, red. (Scale bars: 50 µm.) Results are shown as mean ± SEM. Significant differences between the means were detected after an ANOVA. *P < 0.05, **P < 0.01, ***P < 0.001, ****P < 0.0001, n.s., not significant. Show Less |
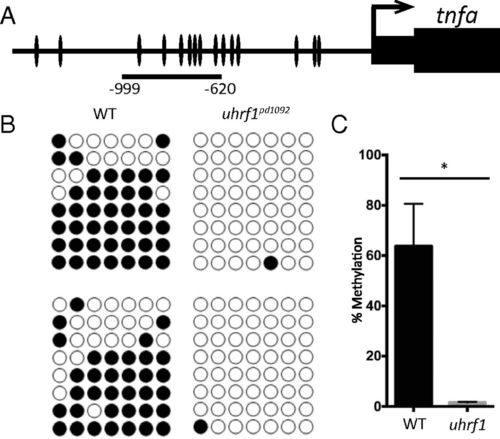
The tnfa promoter is hypomethylated in uhrf1pd1092 gut epithelial cells. (A) Schematic of zebrafish tnfa promoter, with individual CpG dinucleotides indicated. The region used for bisulfite sequencing spans -620 bp to -999 bp. (B) Biological replicates of bisulfite sequencing data from WT (n = 8 clones each) and mutant (n = 8 clones each) samples. (C) Quantification of DNA methylation levels from biological replicates. Bars represent mean ± SEM; *P < 0.05. PHENOTYPE:
|
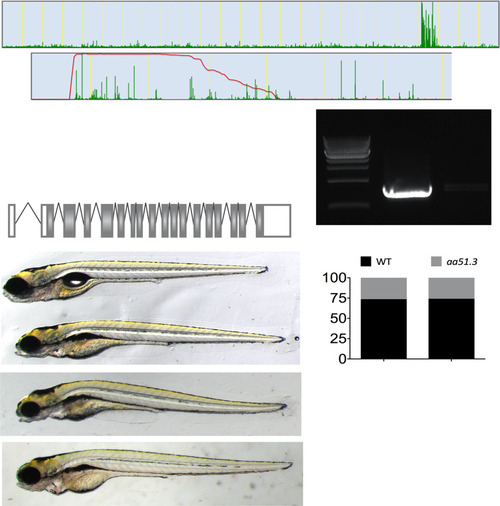
Isolation of the aa51.3pd1092 locus. A splice-site mutation in uhrf1 is causative of the aa51.3pd1092 phenotype. (A, A′, and A′′) Whole exome sequencing of WT and aa51.3pd1092 larvae showing linkage to chromosome 22 in SNPTrack (A), the homozygosity interval (A′), and positional mapping of the region (A′′), which identified a splice-site mutation in the splice donor site at the end of exon five (star) in uhrf1. (B) uhrf1 exons 3 through 8 can be amplified in WT but not mutant larvae. (C and D) Noncomplementation of aa51.3pd1092 (C, Middle) with uhrf1hi3020 (C, Bottom). Brightfield image of noncomplementation (C) and quantification of failure to complement (D). (D: aa51.3pd1092 incross: n = 90 WT, n = 33 mutant; aa51.3pd1092; uhrf1hi3020 complementation: n = 250 WT; n = 89 mutant). |
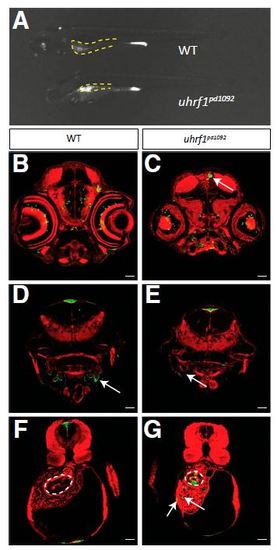
TgBAC(tnfa:GFP) expression in WT and uhrf1pd1092 larvae. (A) Whole-mount image of WT and uhrf1pd1092 mutants showing the specificity of TgBAC(tnfa:GFP) up-regulation in the intestine (yellow dotted lines). (B–G) Confocal images of cross-sections stained with phalloidin (red). (B and C) Both WT and mutant larvae have GFP-positive cells in the brain and eye. The white arrow (C) points to an area of increased GFP expression in the mutant. (D and E) WT and mutant larvae express TgBAC(tnfa:GFP) in the gills (arrows). (F and G) Scattered GFP-positive cells are detected in the liver of mutants (G) but not in WT siblings. White dotted lines encircle the anterior gut; mutants display elevated TgBAC(tnfa:GFP) in the epithelium. (Scale bars: 50 µm.) EXPRESSION / LABELING:
|
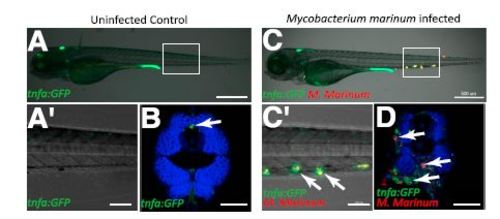
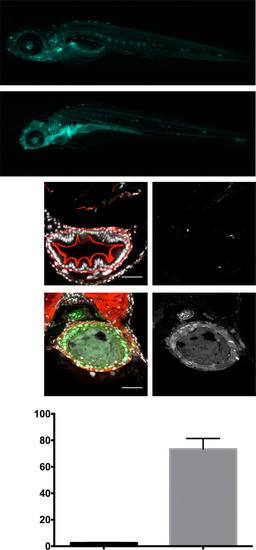
M. marinum infection induces expression of TgBAC(tnfa:GFP) in WT larvae. (A and A′) Uninfected control TgBAC(tnfa:GFP) 120 hpf larvae at low magnification (A) and higher magnification of boxed area (A′). (B) Confocal image of a cross-section of an uninfected 120 hpf WT larva. Phalloidin, blue. Arrow points to basal TgBAC(tnfa:GFP) expression. (C and C′) M. marinum-infected (red) 120 hpf TgBAC(tnfa:GFP) larva at low magnification (C) and higher magnification of boxed area (C′). Arrows point to colocalization of TgBAC(tnfa:GFP) positive cells with M. marinum. (D) Cross-section through M. marinum-infected (red) 120 hpf TgBAC(tnfa:GFP) larva. Phalloidin, blue. Arrows point to TgBAC(tnfa:GFP) positive granulomas surrounding M. marinum bacteria. (Scale bars: A and C, 500 µm; A′ and C′, 100 µm; B and D, 50 µm.) |
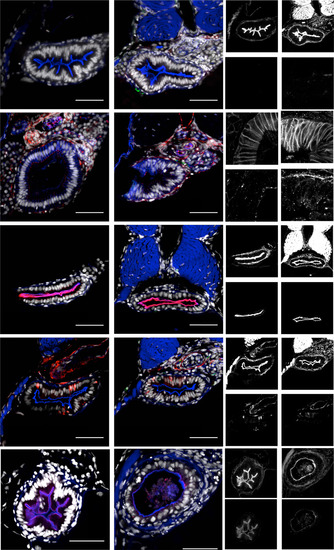
uhrf1pd1092 intestines are morphologically indistinguishable from WT before tnfa elevation at 96 hpf. Shown are confocal images of cross-sections. (A and B) WT and mutant larvae stained for TUNEL. (A′, A′′, B′, and B′′) Typical epithelial morphology in WT (A′) and mutant (B′) larvae. No TUNEL-positive cells in WT (A′′) or mutant (B′′) larvae. WT (C) and mutant (D) larvae stained for pan-cadherin and ZO-1. (C′, C′′, D′, and D′′) Basolateral localization of pan-cadherin in WT (C′) and mutant (D′) larvae. Apical localization (arrows) of ZO-1 in WT (C′′) or mutant (D′′) larvae. WT (E) and mutant (F) larvae stained for mature apical membrane with 4e8 (arrows). (E′, E′′, F′, and F′′) Phalloidin staining in WT (E′) and mutant (F′) larvae. Apical membrane marked by 4e8 staining in WT (E′′) or mutant (F′′) larvae. Enteroendocrine cells in WT (G) and mutant (H) larvae marked by 2f11 (arrows). (G′, G′′, H′, and H′′) Phalloidin staining inWT (G′) and mutant (H′) larvae. 2f11 positive enteroendocrine cells in WT (G′′) or mutant (H′′) larvae. TgBAC(anxa2b-RFP) is a late marker of gut differentiation and is localized apically (arrows) in WT (I) and mutant (J) larvae at 120 hpf. Although the mutant phenotype is present, TgBAC(anxa2b-RFP) is expressed. (I′,I′′, J′, and J′′) Phalloidin staining in WT (I′) and mutant (J′) larvae. Apical TgBAC(anxa2b-RFP) in 120 hpf WT (I′′) or mutant (J′′) larvae. (Scale bars: 50 µm.) |
Elevated NFKB:EGFP expression in the intestine of uhrf1d1092 mutants. Intestinal expression of Tg(NFKB:EGFP) in WT (A) and uhrf1pd1092 (A′) mutants at 120 hpf. The intestine is highlighted by a red dotted line; expression is elevated in mutants. (B and C) Confocal images of cross-sections of WT (B) and mutant (C) larvae. Mutants have elevated NFKB:EGFP in the intestinal epithelium (white dotted line). (D) Quantification of Tg(NFKB:EGFP) intestinal fluorescence (measured in arbitrary units, a.u.) in WT and mutant larvae. ****P < 0.0001. |
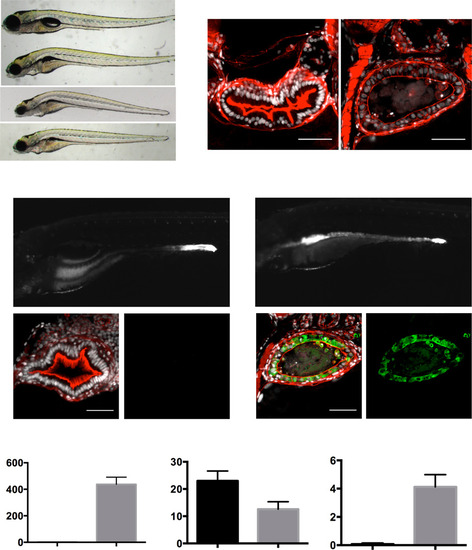
A newly identified allele of dnmt1 is similar to uhrf1 and displays elevated TgBAC(tnfa:GFP) expression. (A) cc39.3pd1093 (Middle), a mutant recovered from our forward genetic screen, had a similar phenotype to uhrf1pd1092 and failed to complement (Top) with dnmt1s872 (Bottom). (B) Confocal images of crosssections through WT and dnmt1pd1093 mutants revealed excessive cell shedding (arrows), luminal debris, and a flattened epithelium in mutants. (C and D) Elevated TgBAC(tnfa:GFP) expression was observed in the intestinal epithelium (encircled by a red dotted line) of dnmt1pd1093 mutants (Upper and Lower Right) but not WT larvae at 120 hpf. Red arrows point to the intestinal epithelium. The yellow frame indicates the plane of section for C and D, Lower. Crosssections (Lower) through WT (C) and dnmt1pd1093 mutants (D) revealed up-regulation of TgBAC(tnfa:GFP) in the intestinal epithelium of mutants. (E) dnmt1pd1093 mutants have increased TgBAC(tnfa:GFP) epithelial fluorescence (measured in arbitrary units, a.u.), decreased cell height, and increased cell shedding, similar to uhrf1pd1092 mutants. ***P < 0.001, ****P < 0.0001. |