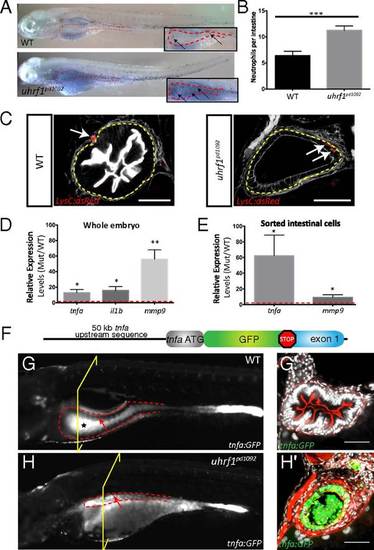
Intestinal inflammation in uhrf1pd1092 mutants. Increased neutrophil recruitment, neutrophil infiltration into the intestinal epithelium, and elevated proinflammatory cytokine expression is observed in the intestine of uhrf1pd1092 mutants. (A) Whole-mount images of WT (Upper) and mutant (Lower) 120 hpf larvae stained with sudan black to mark neutrophils. Insets show a higher magnification view of the intestine (red dotted line), and arrows point to individual neutrophils. (B) Quantification of neutrophils in the intestinal area in WT (black) and mutant (gray) larvae. (n = 21 WT; n = 25). (C) Confocal images of cross-sections showing neutrophil (red) localization in 120 hpf WT and uhrf1pd1092 mutant larvae expressing LysC:dsRed. White arrows indicate neutrophils, which have infiltrated into the intestinal epithelium (yellow dotted line) in mutants but are restricted to the mesenchyme of WT. (Scale bars: 50 µm.) (D) Relative expression (mutant/WT) of proinflammatory genes in whole larvae. All genes are significantly elevated in mutants compared with WT. (E) Relative expression (mutant/WT) of tnfa and mmp9 in sorted intestinal epithelial cells. tnfa is greatly up-regulated in the intestine of mutants. (F) TgBAC(tnfa:GFP) construction schematic. (G and G′) Whole-mount (G) and confocal image of cross-section (G′) of a 120 hpf WT TgBAC(tnfa:GFP) transgenic larvae. The black star in G highlights autofluorescence in the WT gut, whereas the arrow points to the anterior gut epithelium that is devoid of TgBAC(tnfa:GFP) expression. (H and H′) Whole-mount (H) and confocal image of cross-section (H′) of 120 hpf uhrf1pd1092 larva with TgBAC(tnfa:GFP) in intestinal epithelium. The arrow highlights elevated epithelial expression of TgBAC(tnfa:GFP) in the intestine. The yellow bracket indicates the plane of section for G2 and H2. *P < 0.05, **P < 0.01, ***P < 0.001. Show Less
|
