
Fig. 1
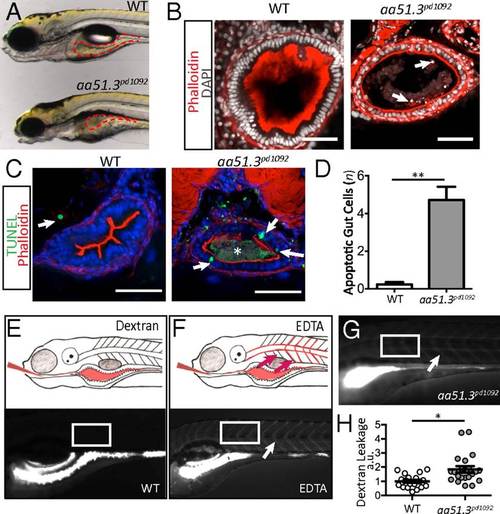
aa51.3pd1092 mutants have an IBD-like phenotype. A mutant with excessive intestinal cell shedding and apoptosis and perturbed epithelial morphology was isolated from a forward genetic screen. (A) WT (Upper) and aa51.3pd1092 mutant (Lower) larvae at 120 hpf. (B) Confocal images of WT and aa51.3pd1092 cross-sections. Arrows point to shed cells in the mutant. (C) Confocal images of cross-sections. TUNEL+ cells (green; arrows) in 120 hpf WT and aa51.3pd1092 larvae. Asterisk marks luminal debris. (D) Apoptotic cells in the anterior gut epithelium (n = 13 WT; n = 18 mutants). (E) Schematic of dextran gavage (Upper) and image of 120 hpf WT larva 30 min after gavage (4,000 MW dextran; Lower). (F) Schematic of barrier perturbation after EDTA + dextran cogavage (Upper) and image of 120 hpf WT larva 30 min after gavage (Lower). (G) Dextran gavage in aa51.3pd1092 mutants. Arrow marks extra extraintestinal dextran (F and G). White box indicates region of interest (ROI) measurement (E–G). (H) Quantification of dextran leakage as measured by fluorescence intensity (measured in arbitrary units, a.u.) in WT and mutant larvae after 30 min (n = 19 WT; n = 21 mutants). Mutants show a significant barrier defect. (Scale bars: 50 µm.) Bars represent mean ± SEM. *P < 0.0001, **P < 0.01. Show Less |
| Fish: | |
|---|---|
| Observed In: | |
| Stage: | Day 5 |