
Fig. S3
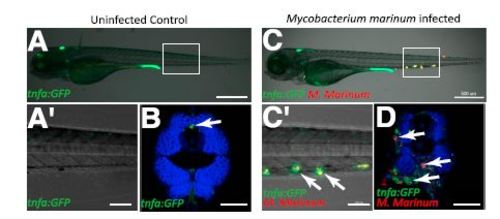
M. marinum infection induces expression of TgBAC(tnfa:GFP) in WT larvae. (A and A′) Uninfected control TgBAC(tnfa:GFP) 120 hpf larvae at low magnification (A) and higher magnification of boxed area (A′). (B) Confocal image of a cross-section of an uninfected 120 hpf WT larva. Phalloidin, blue. Arrow points to basal TgBAC(tnfa:GFP) expression. (C and C′) M. marinum-infected (red) 120 hpf TgBAC(tnfa:GFP) larva at low magnification (C) and higher magnification of boxed area (C′). Arrows point to colocalization of TgBAC(tnfa:GFP) positive cells with M. marinum. (D) Cross-section through M. marinum-infected (red) 120 hpf TgBAC(tnfa:GFP) larva. Phalloidin, blue. Arrows point to TgBAC(tnfa:GFP) positive granulomas surrounding M. marinum bacteria. (Scale bars: A and C, 500 µm; A′ and C′, 100 µm; B and D, 50 µm.) |