- Title
-
sox21a directs lateral line patterning by modulating FGF signaling
- Authors
- Ariza-Cosano, A., Bensimon-Brito, A., Gómez-Skarmeta, J.L., Bessa, J.
- Source
- Full text @ Dev. Neurobiol.
|
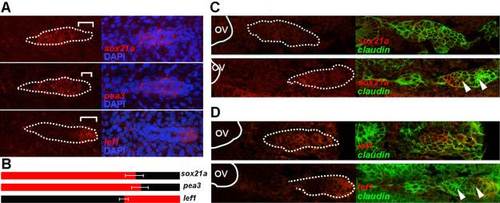
Expression pattern of sox21a, pea3, and lef1 in the pLL primordium. A) Left panels show confocal images of the pLL primordium at 36hpf labeled with the indicated RNA probe in the respective order: sox21a, pea3, and lef1 (red; top to bottom). White dotted lines mark the borders of the pLL primordium and white brackets mark the distance from the tip of the pLL primordium leading zone to the limit of expression of the respective transcript. Right panels show the overlay with the nuclear marker DAPI (blue). B) Diagram representing the limits of expression for each gene (red) as described in A) (white brackets). The number of pLL primordia analyzed were the following: sox21a (n = 6), pea3 (n = 5), and lef1 (n = 6). Standard deviation of the measured distances is represented. C and D) Expression of sox21a (C) and lef1 (D) early in the development of the pLL, previous to the formation of the first proneuromasts (above panels), and at a latter stage when the first proneuromasts is already detected (below panels). In situ hybridization signal is represented in red and GFP from the cldnb:gfp transgenic line in green. The otic vesicle is outlined by a white line (OV) and arrowheads mark proneuromasts. |
|
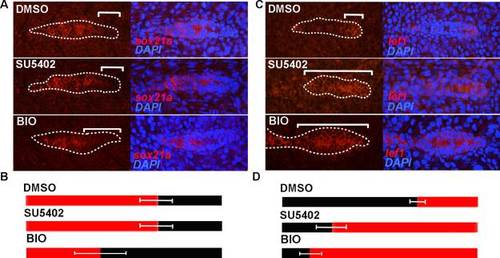
Effect of the knockdown of the Fgf pathway by SU5402 and the ectopic activation of the Wnt pathway by BIO in the expression of sox21a and lef1. A and C) Expression pattern of sox21a (A) and lef1 (C) in controls (DMSO) and SU5402 incubated embryos (SU5402) and BIO incubated embryos (BIO). Left panels show the expression pattern of the respective gene and right panels the overlay with the nuclear marker DAPI (blue). White brackets represent distance from the leading tip of the pLL primordium to the limit of expression of the respective transcript. B and D) Diagram representing in red the limits of expression of sox21a (B) and lef1 (D) in control (DMSO), SU5402 (SU5402) or BIO incubation conditions (BIO). The number of pLL primordia analyzed were the following: sox21a DMSO (n = 8), sox21a SU5402 (n = 11), sox21a BIO (n = 19), lef1 DMSO (n = 10) and lef1 SU5402(n = 9), lef1 BIO (n = 10). Standard deviation of the measured distances is represented. |
|
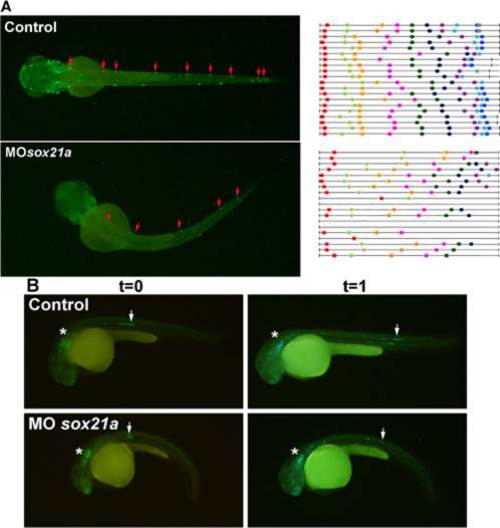
Effect of sox21a knockdown in the formation of neuromasts and pLL primordium migration. A) Left panels represent dorsal images of 60hpf 3240:gfp transgenic embryos that drive expression of GFP in neuromasts (red arrows). The right panel represents the distribution of neuromasts (color dots) in different individuals (black lines). In both cases, left and right panels, above represent controls and below sox21a morphant embryos. B) Lateral images of 3240:gfp transgenic embryos acquired at two different time points, T0 (left panels; 36hpf) and T1(right panels; 42hpf). Asterisks mark the otic vesicle and arrows the pLL primordia. Controls are displayed above and sox21a morphant embryos below. The distance traveled by the pLL primordium between these two time points was measured for several embryos (n = 10 for controls and n = 10 for MOsox21a embryos). |
|
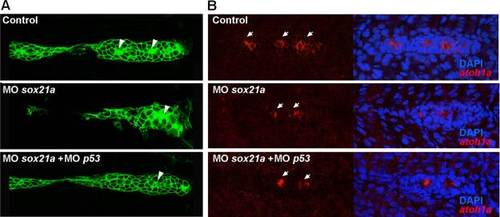
The knockdown of sox21a affects the assemble of proneuromasts and the expression of the proneural gene atoh1a. A) Expression of the membrane tagged GFP from the trangenic line cldnb:gfp in the different experimental backgrounds, as annotated: Control (Control), sox21a morpholino (MOsox21a) and double sox21a and p53 morpholinos (MOsox21a+MOp53) backgrounds. White arrowheads mark proneuromasts. B) Expression of atoh1a (red) in the pLL primordium of similar backgrounds as annotated in A (Control; MOsox21a and MOsox21a+MOp53). White arrows mark clusters of atoh1a expression. |
|
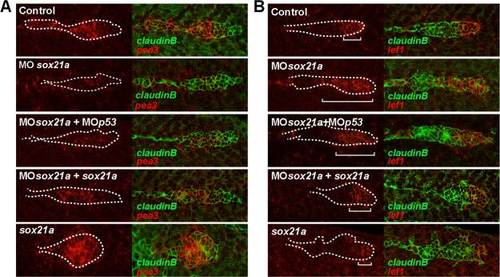
Knockdown of sox21a results in a reduction of Fgf signaling and in an expansion of the Wnt signaling domain. The expression pattern in the pLL primordium of pea3 (A) or lef1 (B) is detected by fluorescent in situ hybridization in a cldnb:gfp transgenic background. Left panels represent the expression of the respective genes (red) and right panels the overlay with the GFP signal from the cldnb:gfp transgenic line (green). Different experimental conditions are shown per row, ordered top to bottom as annotated: Control (Control), sox21a morpholino background (MOsox21a), double sox21a and p53 morpholinos background (MOsox21a+MOp53), sox21a morpholino coinjected with sox21a mRNA (MOsox21a+sox21a) and injection of sox21a mRNA alone (sox21a). White dotted lines mark the borders of the pLL primordium and white brackets mark the distance from the posterior tip of the pLL primordium to the limit of expression of lef1. |
|
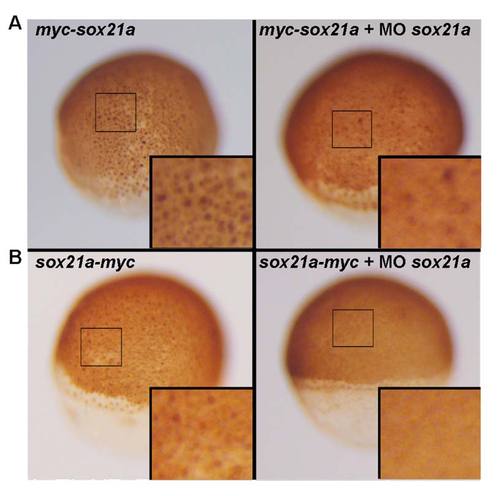
sox21a morpholino activity assay. A) 1 Cell stage zebrafish embryos were injected with mRNA encoding for sox21a fused to a N terminal Myc tag, which lacks the target site for the sox21a morpholino, thereby being insensible to it. Injections were performed with this mRNA alone (left) or mixed with the sox21a morpholino (right). In both cases the nuclear Myc tag is detected by immunostaining (29). B) A similar approach was performed using a mRNA encoding for sox21a fused to a C terminal Myc tag, which is sensible to the sox21a morpholino. In this case, the Myc tag is only detected when the mRNA is injected alone (left) while the co-injection with the sox21a morpholino efficiently targets the mRNA and blocks its translation. |
|
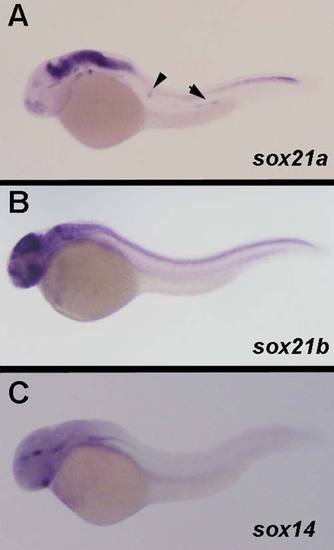
Expression pattern of sox21a, sox21b and sox14 in 36hpf zebrafish embryos. A) sox21a expression is detected in the developing pLL primordium (black arrow) and neuromasts (black arrowhead), while sox21b (B) and sox14 (C) are not detected during the development of this organ. |
|
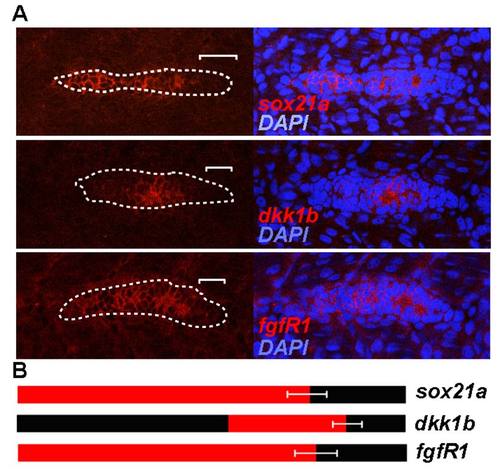
Expression pattern of sox21a, dkk1b and fgfr1 in the pLL primordium of 36hpf zebrafish embryos. A) Left panels show confocal images of the pLL primordium labeled with the indicated RNA probe in the respective order: sox21a, dkk1b and fgfr1(red; top to bottom). White dotted lines mark the borders of the pLL primordium and white brackets mark the distance from the posterior tip of the pLL primordium to the limit of expression of the respective transcript. Right panels show the overlay with the nuclear marker DAPI (blue). B) Diagram representing the expression pattern of the different genes (red). The limits of expression for each gene were defined by measuring the distance from the posterior tip of the pLL primordium to the limit of expression of the respective transcript as described in A) (white brackets). Standard deviation of the measured distances for each transcript is represented. |
|
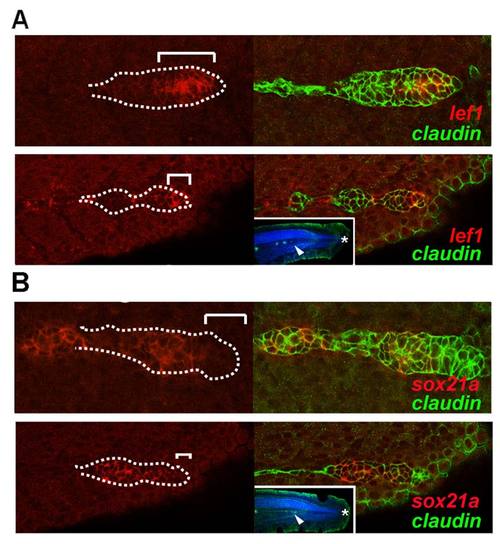
Expression of lef1 (A) and sox21a (B) during late stages of the pLL development. Left panels show respective gene expression (red) during migration (36hpf; above panels) and previous to terminal differentiation of the pLL (46hpf; below). Right panels show the overlay of the expression of the respective gene (red) and GFP from the cldnb:gfp transgenic background that marks the pLL. White brackets mark the distance from the tip of the pLL primordium leading zone to the limit of expression of the respective transcript. Insets show the position of the pLL primordium (arrowhead) near the tip of the tail (asterisk) counter stained with DAPI (blue). |
|
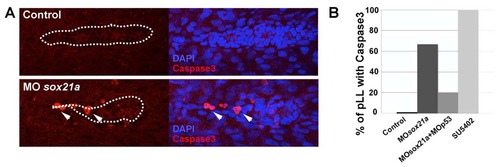
Cell death detection in the pLL of sox21a morphant embryos. A) Cell death was assayed by performing an immunostaining against cleaved Caspase 3 (red; left images) in control embryos (above images) and sox21a morphant embryos (bottom images). Right images show the overlay with the nuclear marker DAPI (blue). White dotted lines mark the borders of the pLL primordium and arrows point to cleaved Caspase 3 stained cells within the pLL primordium. B) The percentage of pLL primordia stained with cleaved Caspase 3 was quantified in Controls (Control; n=5), sox21a morpholino (MOsox21a; n=15), double sox21a and p53 morpholino (MOsox21a+MOp53; n=10) and SU5402 treated (SU5402; n=8) backgrounds. |
|
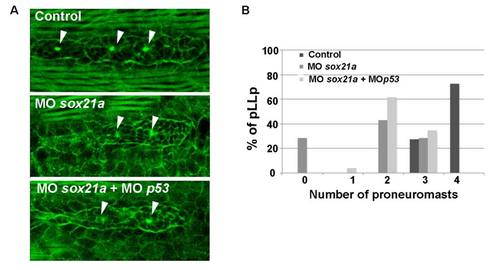
Detection of rossetes in the pLL primordium. A) Phalloidin conjugated with FICT (phalloidin-FITC; green) was used to detect the proneuromast in control (Control), sox21a morphants (MOsox21a) and MOsox21a coinjected with MOp53 (MOsox21a + MOp53) embryos at 36hpf. B) The graph represents the percentage of pLL primordia having 0, 1, 2 or 3 proneuromasts detected by phalloidin-FITC in control (Control; n=11), sox21a knockdown (MOsox21a; n=7) and MOsox21a co-injected with p53 morpholino (MOsox21a+MOp53; n= 26) embryos. |
|
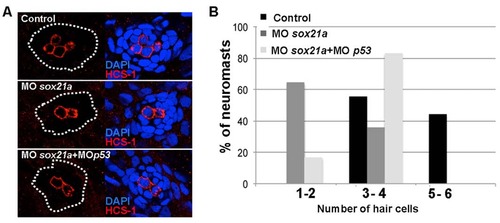
Immunodetection of hair cells in differentiated neuromasts of sox21a morphant embryos. A) An anti HCS-1 antibody was used to detect hair cells (red) in differentiated neuromasts of controls (Control), sox21 morphant (MOsox21a) or sox21 and p53 double morphant embryos (MOsox21a+MOp53). Embryos were double stained with the nuclear marker DAPI (blue, right images). B) Graphs representing the percentage of analyzed neuromasts having 1 to 2, 3 to 4 or 5 to 6 differentiated hair cells, in a control (black bars; n=9), sox21a morphant (dark gray bars; n=4) or sox21a and p53 double morphant (light gray bars; n=12) backgrounds. Embryos were fixed at 72hpf. |
|
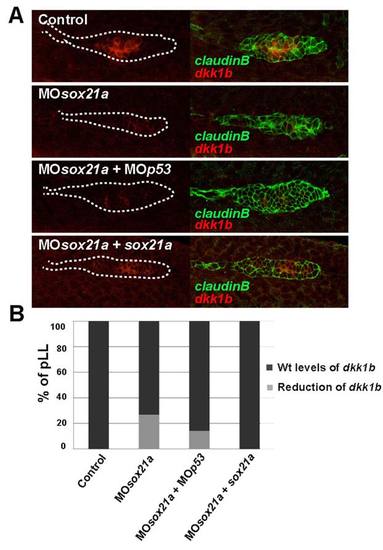
Effect of the sox21a knockdown in the expression of dkk1b in the pLL primordium. A) The expression of dkk1b was detected by in situ hybridization (red) in the different backgrounds: Control (Control), sox21a morphant (MOsox21a), sox21a and p53 double morphant (MOsox21a+MOp53) and sox21a morpholino co-injected with a sox21a mRNA insensible to the morpholino (MOsox21a+sox21a). Injections were performed in a cldnb:gfp transgenic line allowing to visualize the pLL by GFP expression (green; right panels). White dotted lines mark the borders of the pLL primordium. B) Graph representing the percentage of pLL primordia with wild type or reduced expression of dkk1b in Controls (Control; n=15), sox21a morpholino (MOsox21a; n=56), double sox21a and p53 morpholino (MOsox21a+MOp53; n=7) and sox21a morpholino co-injected with sox21a mRNA ( MOsox21a+sox21a; n=10) backgrounds. |
|
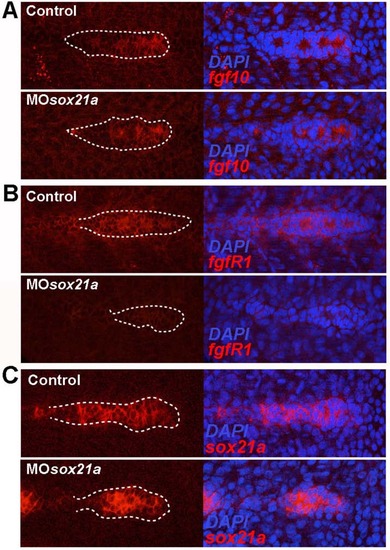
Effect of the sox21a knockdown in the expression of fgf10, fgfr1 and sox21a in the pLL primordium. The expression of fgf10 (A), fgfr1 (B) and sox21a (C) was observed using in situ hybridization for these three transcripts. Control embryos (above) and sox21a morphant embryos (below) are depicted. Transcript expression alone (red; left images) and the corresponding overlap with the nuclear marker DAPI (blue; right images) are displayed. White dotted lines mark the borders of the pLL primordium. |
|
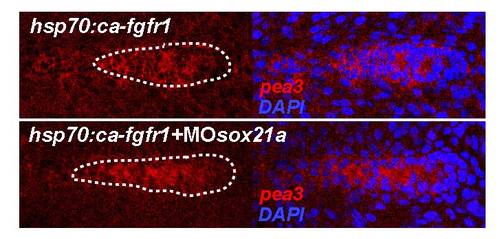
Knockdown of sox21a in a fgfr1 constitutive activated background. In in situ hybridization for pea3 (red) is shown in the left panels for transgenic embryos ectopically expressing a constitutive activated form of fgfr1 (hsp70:ca- fgfr1) and this same background injected with the sox21a morpholino (hsp70:ca- fgfr1+MOsox21a). Co-staining of pea3 and the nuclear marker DAPI (blue) are represented in the right panels. The pLL primordium is highlighted by a white doted line. |

