
|
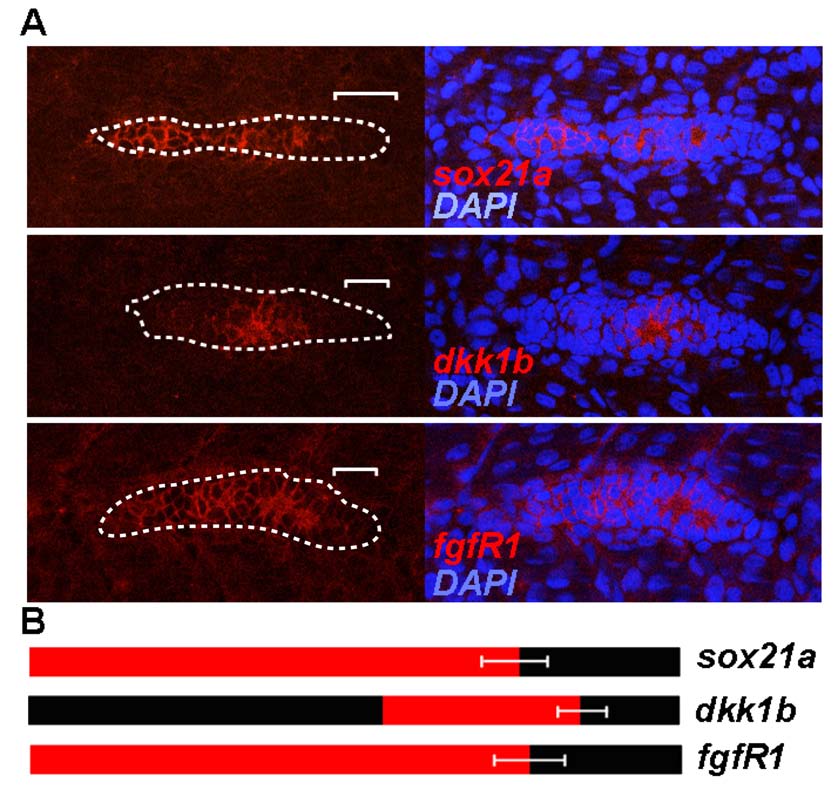
Fig. S3 Expression pattern of sox21a, dkk1b and fgfr1 in the pLL primordium of 36hpf zebrafish embryos. A) Left panels show confocal images of the pLL primordium labeled with the indicated RNA probe in the respective order: sox21a, dkk1b and fgfr1(red; top to bottom). White dotted lines mark the borders of the pLL primordium and white brackets mark the distance from the posterior tip of the pLL primordium to the limit of expression of the respective transcript. Right panels show the overlay with the nuclear marker DAPI (blue). B) Diagram representing the expression pattern of the different genes (red). The limits of expression for each gene were defined by measuring the distance from the posterior tip of the pLL primordium to the limit of expression of the respective transcript as described in A) (white brackets). Standard deviation of the measured distances for each transcript is represented.