
- Title
-
Cell-Fibronectin Interactions Propel Vertebrate Trunk Elongation via Tissue Mechanics
- Authors
- Dray, N., Lawton, A., Nandi, A., Jülich, D., Emonet, T., and Holley, S.A.
- Source
- Full text @ Curr. Biol.
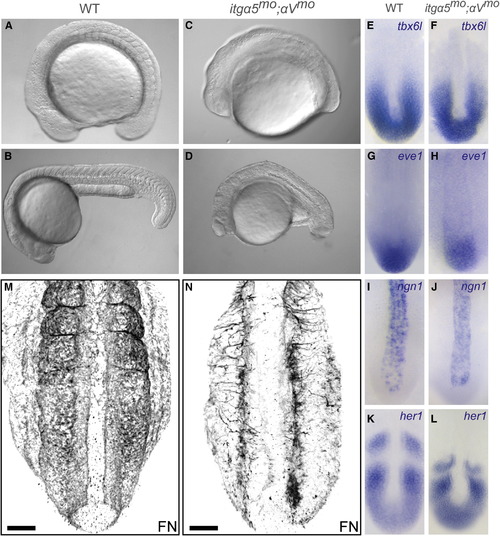
Axis Elongation Defects after Loss of Both itgα5 and itgαV (A-D) Wild-type (WT) (A and B) and truncated (C and D) itgα5mo;αVmo embryos at the end of trunk elongation; i.e., 16-somite-stage embryos (A and C) and 24 hr postfertilization (hpf) (B and D). At the 16-somite stage, we find that distance from the otic vesicle to the anterior of the head in itgα5mo;αVmo embryos (n = 30) is 74% (SD = 8%; p < 0.05) of that in WT embryos (n = 20) and that the distance from the otic vesicle to the tip of the tail is 71% of that in WT embryos (SD = 7%; p < 0.05). (E–L) In situ hybridization of tail bud gene expression in 13-somite-stage embryos. (M and N) FN immunolocalization in 16-somite-stage WT (M) (n = 10) and itgα5mo;αVmo embryos (N) (n = 17). Note the reduction in FN matrix as well as the prominent medial-lateral fiber orientation in (N). Scale bars are 50 μm. In (A–D), anterior is the left. In (E–N), anterior is up. See also Figure S1./p> EXPRESSION / LABELING:
PHENOTYPE:
|
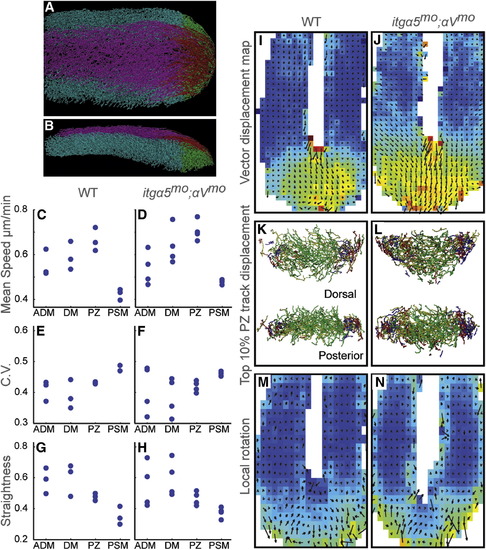
Quantitative Analysis of Cell Motion in the Tail Bud (A and B) Tail bud cell tracks were divided into four regions: ADM (magenta), DM (red), PZ (green), and PSM (cyan). (A) is a dorsal view and (B) is a lateral view of 12- to 14–somite-stage embryos. Anterior is the left. See also Movie S1. (C and D) Mean track speeds. (E and F) The means of the coefficient of variation (C.V.). (G and H) Track straightness, which is equal to length divided by displacement. (I and J) The vector displacement map averages cell motion in sectors. The heat map indicates mean speed, warmer colors indicate higher speeds, and arrows signify averaged 3D velocity vectors. (K and L) The top 10% of PZ tracks exhibiting the largest displacement in each direction (dorsal to ventral [green], medial to lateral [yellow], posterior to anterior [red], and ventral to dorsal [blue]). (M and N) 3D FEM was used to measure the vorticity within the cell flow. Arrows slanting rightward indicate a dorsal to ventral curvature. The ADM is omitted from the vector map and FEM to better visualize motion in the PSM. In (C–H), data are plotted for three WT and four itgα5mo;αVmo embryos. Data sets averaged 163 min in length. p values were calculated via ANOVA with additional validation by permutation tests. See also Figure S2. |
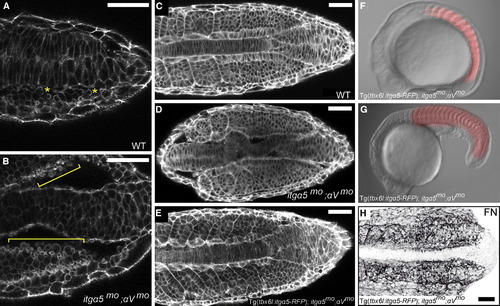
itgα5 Function in the Paraxial Mesoderm Is Sufficient to Rescue Body Elongation in itgα5mo;αVmo Embryos (A) In WT embryos, cells on the surface of the paraxial mesoderm display low levels of blebbing (asterisks), as revealed by phalloidin staining. (B) In itgα5mo;αVmo embryos, cells along the medial surface of the paraxial mesoderm exhibit a dramatic increase in blebbing (brackets). See also Movie S2. (C–E) Phalloidin staining of the cell cortices shows the close alignment of the notochord and paraxial mesoderm in WT embryos (C) (n = 16), the loss of this intertissue adhesion and alignment in itgα5mo;αVmo embryos (D) (n = 31), and the rescue of intertissue adhesion and organization in Tg(tbx6l:itgα5-RFP);itgα5mo;αVmo embryos (E) (n = 10). (F and G) Body elongation is rescued in Tg(tbx6l:itgα5-RFP);itgα5mo;αVmo embryos at 14 hpf (F) and 24 hpf (G). At the 16-somite stage, the trunks of transgenic rescue embryos (n = 40) are 88% of that in WT embryos (SD = 4%; p < 0.05), and the heads are 83% of that in WT embryos (SD = 5%; p < 0.05). RFP fluorescence shows Itgα5 expression in the paraxial mesoderm. (H) Tg(tbx6l:itgα5-RFP) rescues FN matrix assembly and fiber orientation in itgα5mo;αVmo embryos (n = 7). Anterior is left. Note that panels (C–E) and (H) are composites of anterior and posterior images. Scale bars represent 50 µm. See also Figure S3. EXPRESSION / LABELING:
PHENOTYPE:
|
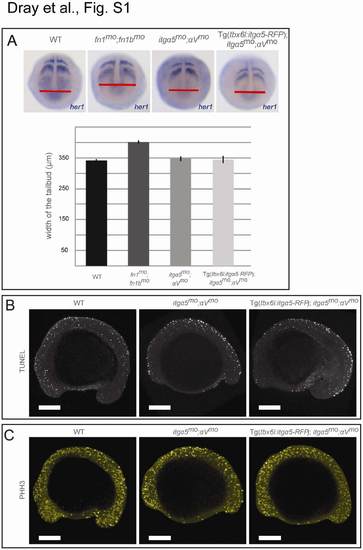
Analyses of Convergence Extension, Apoptosis, and Cell Proliferation in itgα5mo;αVmo Embryos, Related to Figure 1 (A) Wild-type, fn1mo;fn1bmo, itgα5mo;αVmo and Tg(tbx6l:itgα5-RFP);itgα5mo;αVmo embryos were fixed at the tailbud stage and in situ hybridization for her1 was performed. We then measured the medial-lateral width of the tailbud at the level of the posterior tip of the notochord. The fn1mo;fn1bmo embryos (n=30) exhibited a 17.5% increase in width of the tailbud (unpaired t-test; p-value <0.05) which is consistent with previous observations [1]. In contrast, neither itgα5mo;αVmo (n=37) nor Tg(tbx6l:itgα5-RFP);itgα5mo;αVmo embryos (n=24) displayed a change in tailbud width relative to wild type (n=55) (p-value >0.05). Error bars show standard error. The fn1 and fn1b morpholinos have been previously described [2]. |
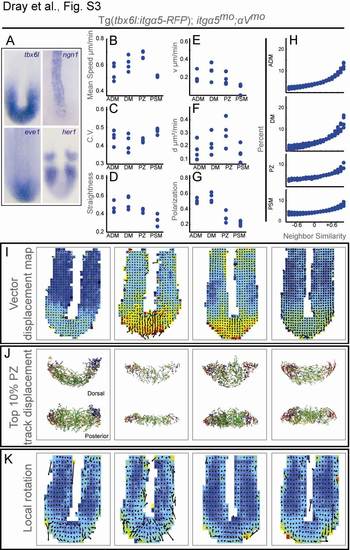
Detailed Characterization of Tg(tbx6l:itgα5-RFP);itgα5mo;αVmo Embryos, Related to Figure 4 (A) In situ hybridization of tailbud gene expression was performed on 13-somites stage embryos. Expression of tbx6l (n=23), eve1 (n=15), neurogenin 1 (n=10) and her1 (n=37) and appear as in wild type. |