
Fig. 2
- ID
- ZDB-FIG-130830-12
- Publication
- Dray et al., 2013 - Cell-Fibronectin Interactions Propel Vertebrate Trunk Elongation via Tissue Mechanics
- Other Figures
- All Figure Page
- Back to All Figure Page
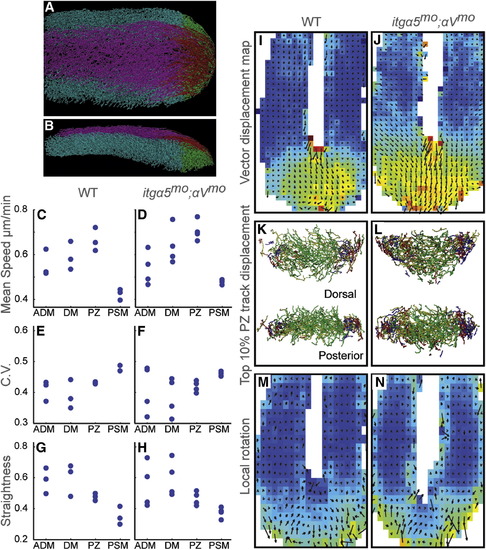
Quantitative Analysis of Cell Motion in the Tail Bud (A and B) Tail bud cell tracks were divided into four regions: ADM (magenta), DM (red), PZ (green), and PSM (cyan). (A) is a dorsal view and (B) is a lateral view of 12- to 14–somite-stage embryos. Anterior is the left. See also Movie S1. (C and D) Mean track speeds. (E and F) The means of the coefficient of variation (C.V.). (G and H) Track straightness, which is equal to length divided by displacement. (I and J) The vector displacement map averages cell motion in sectors. The heat map indicates mean speed, warmer colors indicate higher speeds, and arrows signify averaged 3D velocity vectors. (K and L) The top 10% of PZ tracks exhibiting the largest displacement in each direction (dorsal to ventral [green], medial to lateral [yellow], posterior to anterior [red], and ventral to dorsal [blue]). (M and N) 3D FEM was used to measure the vorticity within the cell flow. Arrows slanting rightward indicate a dorsal to ventral curvature. The ADM is omitted from the vector map and FEM to better visualize motion in the PSM. In (C–H), data are plotted for three WT and four itgα5mo;αVmo embryos. Data sets averaged 163 min in length. p values were calculated via ANOVA with additional validation by permutation tests. See also Figure S2. |