
|
Fig. S3
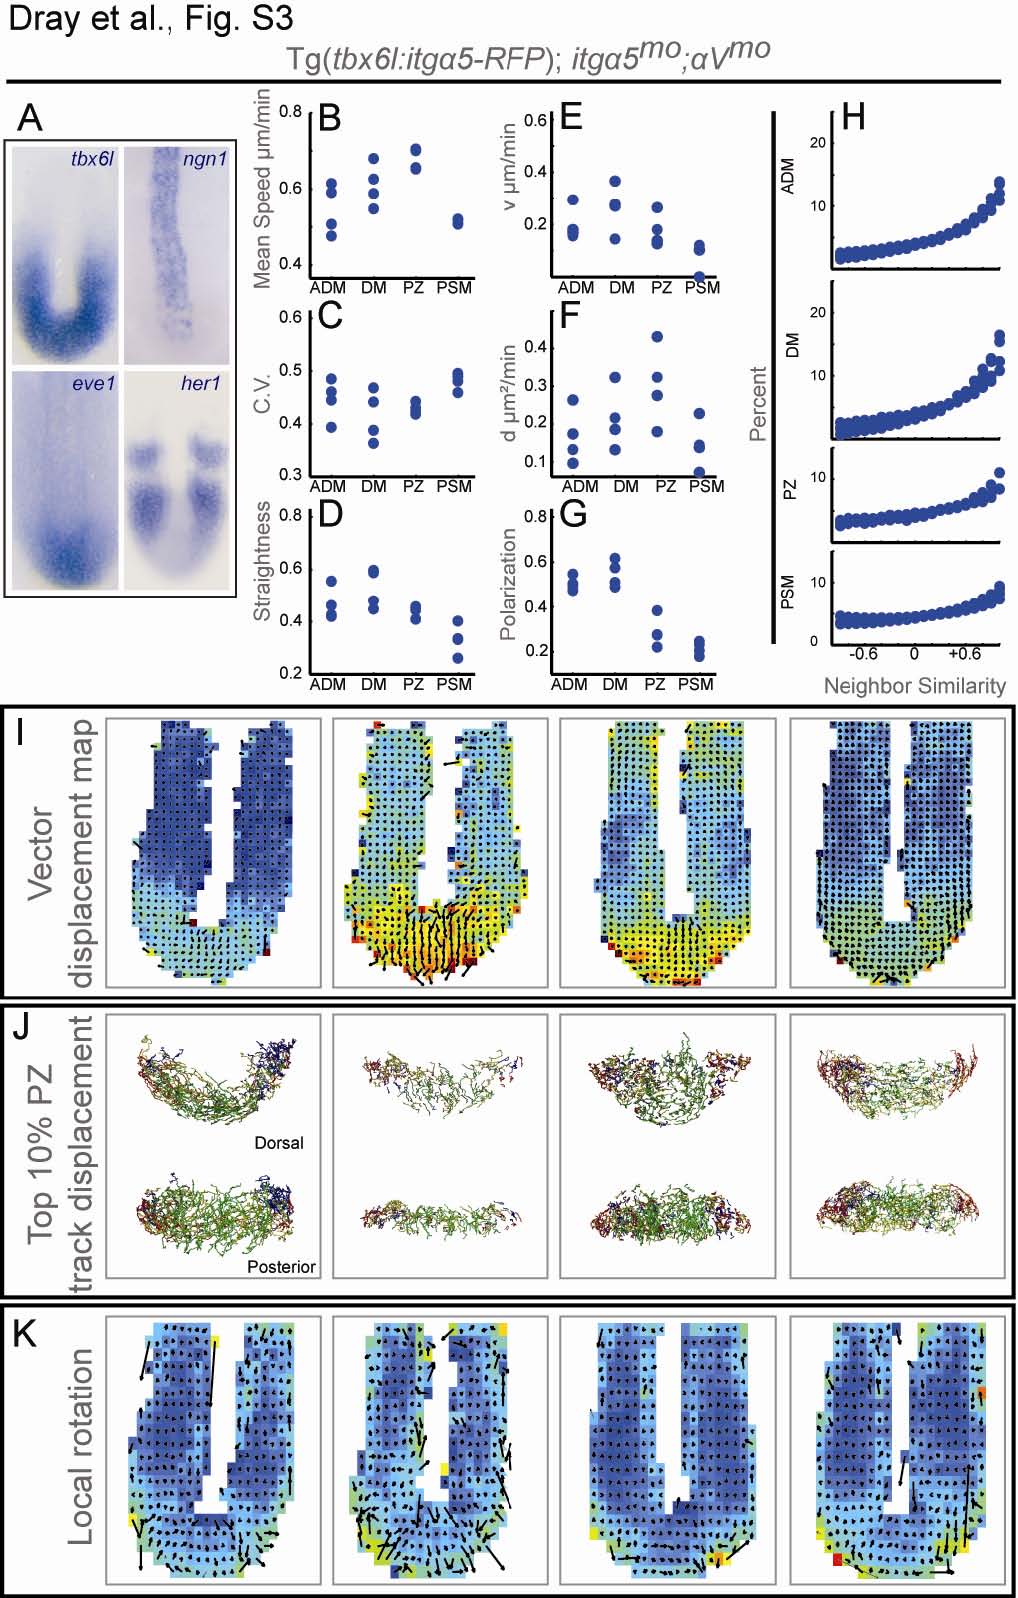
Detailed Characterization of Tg(tbx6l:itgα5-RFP);itgα5mo;αVmo Embryos, Related to Figure 4
(A) In situ hybridization of tailbud gene expression was performed on 13-somites stage embryos. Expression of tbx6l (n=23), eve1 (n=15), neurogenin 1 (n=10) and her1 (n=37) and appear as in wild type.
Quantitative analysis of tailbud cell motion in four Tg(tbx6l:itgα5-RFP);itgα5mo;αVmo embryos.
(B) Mean track speeds.
(C) The means of the coefficient of variation (C.V.).
(D) Track straightness: length divided by displacement. In B-D, p-values for comparison to wild-type data were calculated via ANOVA with additional validation by permutation tests.
Characterizing relative cell motion: directed and diffusive movement, global order and local order.
(E and F) A Bayesian analysis of the MSD determined that cell motion in the tailbud is best modeled using velocity magnitude (E) and diffusion coefficient (F) as parameters [6].
(G) Polarization (φ) measures global order within each domain of the tailbud.
(H) Neighbor similarity quantifies the local order of cell motion. The angles between all adjacent instantaneous velocity vectors for each timepoint are binned such that 1 represents parallel motion, -1 anti-parallel motion, 0 orthogonal motion and the intervening deciles denoting intermediate angles. The percentage of angles in each bin for the four Tg(tbx6l:itgα5-RFP);itgα5mo;αVmo embryos are plotted to give the angle distribution. (E-H) P-values for comparison to the wild-type data were calculated via paired and unpaired t-tests.
Patterns of tailbud cell flow and local curvature of cell motion in Tg(tbx6l:itgα5-RFP);itgα5mo;αVmo embryos.
(I) The vector displacement map averages cell motion in sectors. The heat map indicates mean speed with warmer colors indicating higher speeds and arrows signify averaged 3-D velocity vectors.
(J) The top 10% of PZ tracks exhibiting the largest displacement in each direction (dorsal to ventral [green], medial to lateral [yellow], posterior to anterior [red] and ventral to dorsal [blue]).
(K) 3-D Finite Element Method was used to measure the vorticity within the cell flow. Arrows slanting rightward indicate a dorsal to ventral curvature. The ADM is omitted from the vector map and FEM to better visualize motion in the PSM.