
- Title
-
Anaplastic lymphoma kinase is required for neurogenesis in the developing central nervous system of zebrafish
- Authors
- Yao, S., Cheng, M., Zhang, Q., Wasik, M., Kelsh, R., and Winkler, C.
- Source
- Full text @ PLoS One
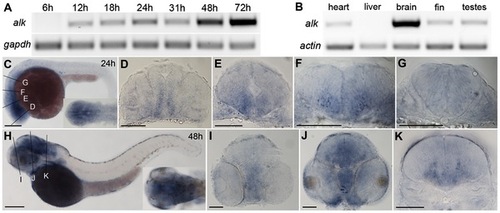
Expression of zebrafish alk. (A) RT-PCR of cDNA at different embryonic stages. gapdh is used as loading control. (B) RT-PCR of cDNA from different adult tissues. beta-actin is used as loading control. (C) Lateral view of whole embryos at 24 hpf with dorsal up and anterior to the left. Insert shows dorsal view of head region. (D–G) Transverse sections of embryos at 24 hpf, at forebrain (D), midbrain (E), rhombomere 2 (r2; F) and r5 (G) levels, corresponding to positions indicated by lines in (C). (H) Lateral view of whole embryo at 48 hpf with dorsal up and anterior to the left. Insert shows dorsal view of head region. (I–K) Transverse sections of embryos at 48 hpf at forebrain (I), midbrain (J), and r5 (K), corresponding to positions indicated by lines in (D). Scale bars: C,H, 200 μm; D–E,I–K, 100 μm. |
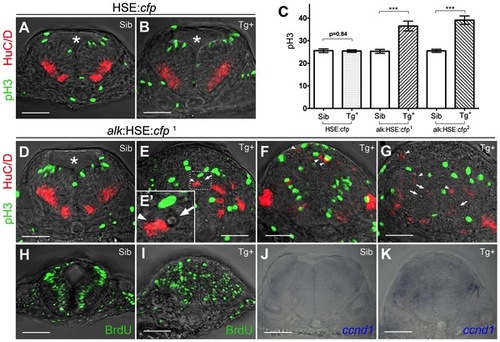
Overexpression of alk promotes cell proliferation and affects neurogenesis. (A,B) Confocal sections of HSE:cfp embryos. Sib (A) and Tg+ (B) embryos show no difference in number and distribution of pH 3 and HuC/D positive cells. (C) Y-axis indicates numbers of pH 3 positive cells counted in a 50 µm confocal stack of the hindbrain. Mean ± SEM, n = 10 embryos in each group. Sib and Tg+ HSE:cfp embryos were not significantly different (p = 0.84). Sib and Tg+ embryos of both alk:HSE:cfp lines were significantly different (***p<0.001). Unpaired two tailed t-test. (D–G) Confocal sections of alk:HSE:cfp1 embryos. Sib (D) and Tg+ (E–G, from three different embryos) had different neural tube shapes. Dividing cells (pH 3, green) and neurons (HuC/D, red) in Tg+ embryos (E–G) were mispositioned (arrowheads), with aberrant patterns. (E′) High magnification of the boxed area in (E). Asterisk labels 4th ventricle. Arrows label small cavities found in the neural tube. (H,I) Confocal sections of alk:HSE:cfp1 embryos, with BrdU labelled cells in S-phase. In Sib (H), BrdU positive cells occupy a region between dividing cells and neurons that exited the cell cycle, in a pattern complementary to pH 3 and HuC/D in (A,B,D). In Tg+ (I), BrdU positive cells were randomly positioned. Smaller dimension of samples in (H,I) might be due to HCl treatment in the experiment procedure. (J,K) Manual sections of embryos after in situ hybridization showed expanded ccnd1 expressions in Tg+ (K) in comparison to Sib embryos (J). Sib, transgenic negative siblings. Tg+, transgenic positive embryos. All images are sections perpendicular to neural tube. Scale bars: 50 μm. |
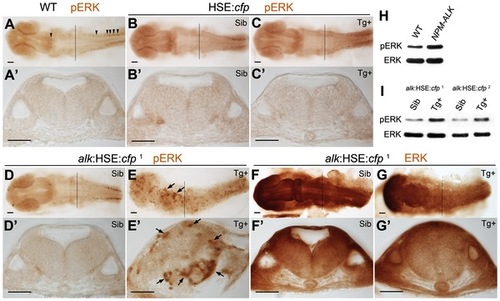
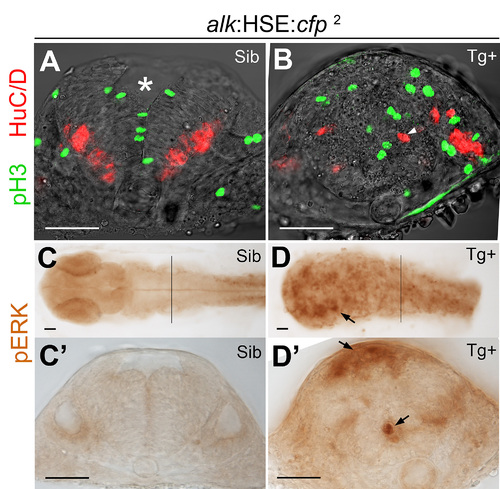
MAPK signaling is activated upon alk overexpression. (A,A′) phospho-ERK (pERK) immunostaining of a 24 hpf wild-type embryo without heat shock. Endogenous MAPK activation is evident in the caudal most hindbrain and spinal cord, but low in other parts of the CNS. (B,B′,C,C′) Both Sib (B,B′) and Tg+ embryos (C,C2) of the HSE:cfp control line were normal and no additional pERK was observed. (D,D2,E,E2) Ectopic pERK (arrows) was evident in Tg+ (E,E′) of the alk:HSE:cfp1 line compared to Sib (D,D′). (F,F2,G,G′) Total ERK was ubiquitously distributed in both Sib (F,F2) and Tg+ (G,G′) embryos of the alk:HSE:cfp1 line and showed no difference. (A2–G2) Transverse sections from embryos at r5 level as indicated by black lines in (A–G). Sib, transgenic negative siblings. Tg+, transgenic positive embryos. ERK, total ERK1/2. pERK, phosphorylated-ERK1/2. Scale bars: 50 µm. (H) Western blot analysis showing more pERK protein in NPM-ALK mRNA injected embryos than in WT at 11 hpf. Each lane represents protein content from five embryos of a 20–50 embryo pool. (I) Western blots showing increased pERK levels in Tg+ versus Sib embryos at 22 hpf in both alk:HSE:cfp lines. Each lane contains proteins equivalent to five embryos of a 20–50 embryo pool. Only dissected anterior parts of embryos were used to eliminate endogenous pERK originating from spinal cord and tail bud. EXPRESSION / LABELING:
PHENOTYPE:
|
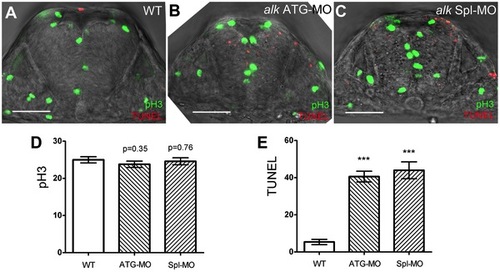
Knock-down of alk does not affect proliferation but induces apoptosis in the hindbrain. (A–C) Confocal sections of 22 hpf embryos after immunostaining with pH 3 (green) and TUNEL (red). Compared to WT (A), both alk ATG-MO injected (B) or alk Spl-MO injected (C) embryos show pH 3 positive cells at normal positions, but more TUNEL positive cells are evident. Note that the size of neural tube in (B,C) is smaller than in (A). (D) Y-axis indicates numbers of pH 3 positive cells in a 50 µm thick confocal stack of hindbrain. Numbers are not significantly different in alk ATG-MO or alk Spl-MO from WT. (E) Y-axis indicates numbers of TUNEL positive cells in the same samples. Both alk ATG-MO and alk Spl-MO numbers were different from that in WT with high significance (***p<0.001). Mean ± SEM, n = 5 embryos in each group. Unpaired two tailed t-test. Scale bars: 50 μm. PHENOTYPE:
|
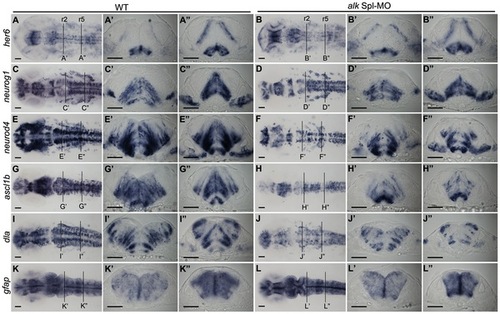
Knock-down of alk impairs neuronal differentiation. (A–L) In situ hybridization of neuronal marker genes with wild-type (A,C,E,G,I,K), and alk Spl-MO injected embryos (B,D,F,H,J,L) at 22 hpf. Images in first row show dorsal views of head region with anterior to the left. (A′–L′,A′′ –L′′) Transverse cross sections at the level of r2 (A′–L′) and r5 (A3 –L3) in WT embryos or alk Spl-MO injected morphants. (A,A2A3,B,B2B3) her6 expression was unchanged in alk morphants compared to WT. (C,C′,C′′,D,D′,D′′) neurog1 expression was unchanged or only slightly reduced in morphants. (E,E′,E′′,F,F′,F′′) neurod4 expression was strongly reduced in morphants in several regions including the hindbrain. (G,G′,G′′,H,H′,H′′) Similarly, ascl1b expression in alk morphants was also significantly reduced. (I,I′,I′′,J,J′,J′′) dla expression in alk morphants was also reduced. (K,K′,K′′,L,L′,L′′) Glia marker gfap expression was unchanged. Scale bars: 50 μm. Lines at r2 and r5 indicate levels of cross sections. EXPRESSION / LABELING:
PHENOTYPE:
|
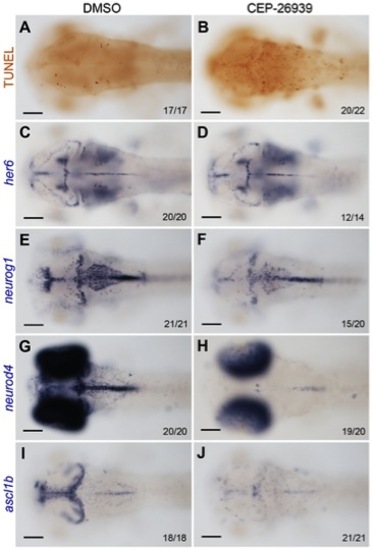
Inhibition of Alk activity by CEP-26939 phenocopies alk morphant defects. (A,C,E,G,I) Embryos at 60 hpf treated with 1% DMSO from 24 hpf were used as negative controls. (B,D,F,H,J) 60 hpf embryos treated with 40 μM CEP-26939 from 24 hpf. (A,B) Inhibitor treated embryos showed more TUNEL-positive apoptotic cells in mid- and hindbrain (B) when compared to DMSO treated embryos (A). (C,D) No significant change was observed for her6 expression in inhibitor treated embryos. (E,F) neurog1 was only slightly reduced in inhibitor treated (F) compared to DMSO treated embryos (E). (G,H,I,J) Both neurod4 and ascl1b expression domains in mid- and hindbrain were almost completely absent in inhibitor treated embryos (H,J). All images show dorsal views with the focal plane on mid- and hindbrain, with anterior to the left. Numbers in each image indicate individuals similar as that shown as representatives and total numbers of embryos investigated. Scale bars: 100 μm. |
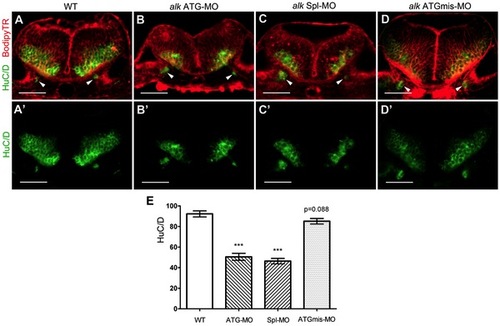
Knock-down of alk reduces the number of differentiated hindbrain neurons. (A–D) Confocal sections of 31 hpf embryos at r5 level immunostained with the pan-neuronal marker HuC/D (green) and co-stained with bodipy-Texas Red (TR, red). The HuC/D channel (green) is separately shown in (A′–D′). Arrowheads point to emerging neurons in the ear, serving as landmark to indicate that all sections were at the same position. In both alk ATG-MO (B,B′) or alk Spl-MO (C,C′) injected embryos, the areas of postmitotic neurons were clearly smaller than in WT (A,A2) or alk ATGmismatch-MO injected embryos (D,D′). The proliferative ventricular and subventricular zones were normal in size. (E) Y-axis indicates numbers of HuC/D expressing cells on sections. Both alk ATG-MO and alk Spl-MO groups were significantly different from WT (***p<0.001), whereas the change in alk ATGmismatch-MO group was not significant (p = 0.088). Mean ± SEM, N = 12 in WT and ATG-MO, N = 14 in Spl-MO and ATGmismatch-MO. Unpaired two tailed t-test. Scale bars: 50 μm. |

Sense controls and expression of zebrafish alk at 72 hpf. (A–D) Negative controls at 24 hpf using a sense probe, corresponding to Fig. 1D–G, respectively. (E–G) Negative controls at 48 hpf using a sense probe, corresponding to Fig. 1I–K, respectively. (H) Lateral view of embryo at 72 hpf with dorsal up and anterior to the left. (I) Dorsal high magnification views of head region at 72 hpf. (J) Negative sense probe control of (I). Scale bars: A–G, 100 μm; H–J, 200 μm. |

Heat-shock inducible transgenic zebrafish lines. (A,B) Diagrams illustrating transgenic cassettes for control line (A) and alk overexpression lines (B). The construct reported by Bajoghli et al. contains eight heat shock element repeats (HSE) with bidirectional promoter activity. This construct was engineered in such a way that alk and cfp were put on each side (B), or just cfp in the control line (A). (C–E) 24hpf embryos from the control line (HSE:cfp, C), alk overexpression line 1 (alk:HSE:cfp1, D), and independent alk overexpression line 2 (alk:HSE:cfp2, E). All embryos received a 1.5 hour long heat shock at 39.5°C and at 10.5 hpf. Bright field images on top and images of the same embryos in CFP channel below. Inserts show representative transgene positive embryos in each line. Arrows point to transgenic negative siblings in each line. They are morphologically normal and not visible in the CFP channel. |

In situ hybridization to detect alk overexpression in alk:HSE:cfp transgenic embryos. A heat shock was performed at 24 hpf. All in situ hybridizations were done using an alk antisense RNA probe, at 1 hour post heat shock (hph) (A), 6 hph (B), 22 hph (C), and shortly after a second HS performed at 48 hpf (D). Inserts show representative transgenic positive embryos. As soon as 1 hour after heat shock, high levels of exogenous alk RNA could be detected in the entire embryo. Reduced staining at 6 hours after HS indicated RNA degradation. Staining almost completely disappeared at 22 hours after HS. A second HS re-activated transcription of overexpressed alk. Arrows points to transgene negative siblings where no exogenous alk was detected. Endogenous alk expression was not detected because of short staining time. |
Proliferation and differentiation in the alk:HSE:cfp2 line. (A,B) Confocal sections of 24hpf embryos of the alk:HSE:cfp2 line. Sib (A) and Tg+ (B) had different neural tube shapes. Dividing cells (pH 3, green) and neurons (HuC/D, red) in Tg+ embryos (B) were both mispositioned (arrowhead), identical to defects observed in the alk:HSE:cfp1 line (Fig. 2). Asterisk labels 4th ventricle. (C,C′,D,D′) Ectopic pERK (arrows) in Tg+ (D,D′) of the alk:HSE:cfp2 line compared to Sib (C,C2), identical to defects observed in alk:HSE:cfp1 (Fig. 3). pERK, phosphorylated-ERK1/2. Sib, transgene negative siblings. Tg+, transgenic embryos. Scale bars: 50 μm. |
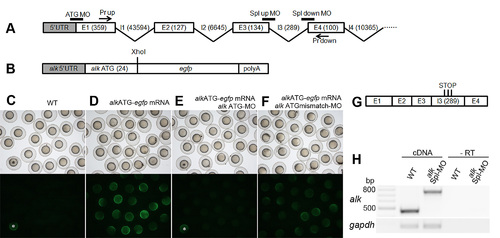
alk MO efficiency test experiments. (A) A schematic diagram showing arrangement of the first four alk exon-intron boundaries and MO binding sites. Numbers show exon/intron sizes in basepairs. (B) A construct containing egfp inserted in frame with the alk ATG site was generated to test the binding efficiency of ATG-MO. (C–F) Injection of this mRNA in combination with MOs resulted in different EGFP translation levels. Embryos at 8 hpf, with bright field images on top and fluorescent images below. Injection of the mRNA resulted in EGFP signal (D). Co-injection with alk ATG-MO blocked its translation (E). alk ATGmismatch-MO did not block its translation (F). Embryos labeled with asterisks in (C) and (E) were taken from the group shown in (D), indicating sufficient fluorescent excitation. (G) A diagram showing aberrant splice products with retention of intron 3, when alk pre-mRNA splicing is blocked by splicing MOs. (H) RT-PCRs were used to test splicing MO efficiency by primers indicated in (A). In Spl-MO injected 24 hpf embryos, the PCR product size was increased by approximately 300 bp (2nd lane) when compared to uninjected wild-type (1st lane), indicating retention of intron 3. -RT controls (3rd and 4th lanes, without reverse transcriptase in cDNA synthesis) excluded contamination by genomic DNA. gapdh was used as loading control. |
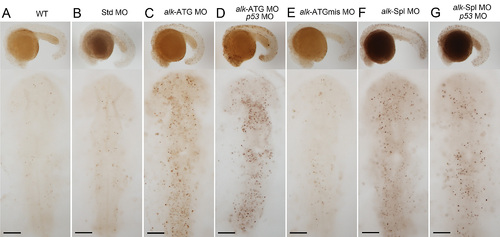
Increased apoptosis in alk morphants. TUNEL staining of embryos at 22 hpf. Images show lateral views on top with anterior to the left, and dorsal views of head region below with anterior to the top. WT (A) or Std-MO injected (B) embryos had only few scattered TUNEL positive cells. In alk ATG-MO (C) or Spl-MO injected embryos (F), TUNEL positive cells increased in number, while ATGmismatch-MO injected (E) looked normal. Co-injections with p53-MO (D,G) failed to attenuate the apoptosis defect indicating specificity of the effect. Scale bars: 100 μm. |

An alk ATG-MO leads to reduced proneural gene expression. (A,C,E,G,I,K) Embryos injected with alk ATGmismatch-MO showed no difference when compared to WT in Fig. 5. (B,D,F,H,J,L) alk ATG-MO injected embryos show the same phenotype as alk Spl-MO injected embryos (Fig. 5). Embryos showed no change in her6, neurog1 and gfap expression, but reduced expression of neurod4, ascl1b and dla identical to alk Spl-MO injected embryos shownin Fig. 5. Images show dorsal views of head regions with anterior to the left. Scale bars: 50 μm. |